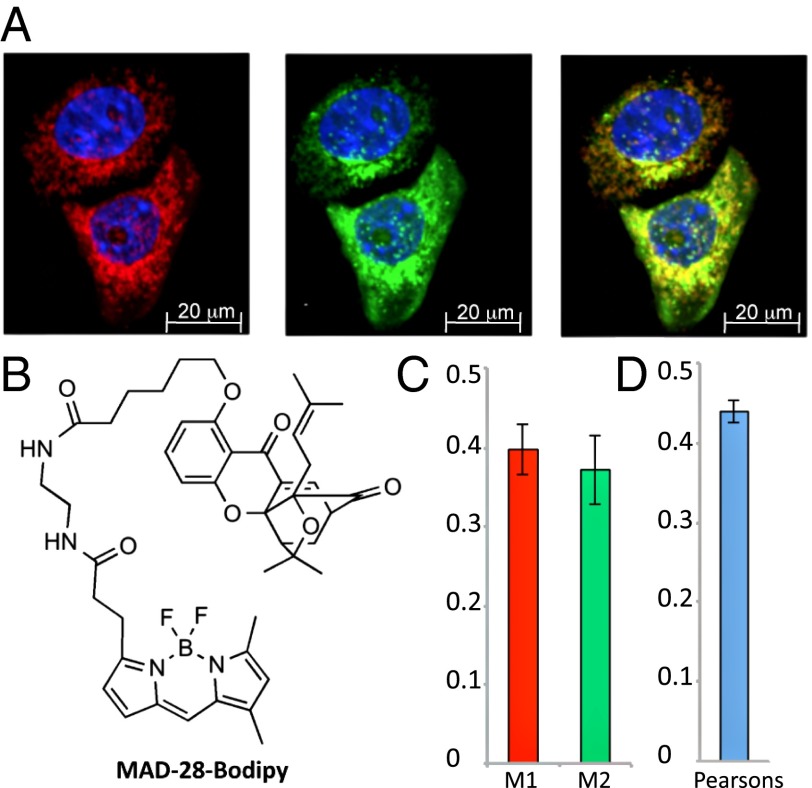
Fig. 2.
Subcellular localization of a MAD-28–Bodipy conjugate. (A) MDA-MB-231 cells labeled with mouse anti-Tom20 and visualized with Alexa Fluor 594 goat anti-mouse (Left) were then incubated with MAD-28–Bodipy (Middle). (Right) Merged image is shown. Nuclei are shown in blue. (B) Structure of the MAD-28–Bodipy. The synthesis of MAD-28–Bodipy is shown in SI Appendix, Fig. S1C. Colocalization efficiency was measured using ImageJ software and is shown as Manders’ coefficients M1 and M2 (C) and Pearson’s correlation coefficient (D). The average and SD were obtained by analysis of at least eight different images.

