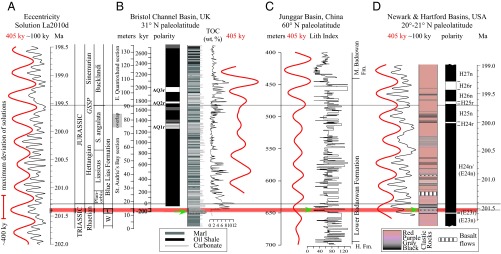
Fig. 2.

LITH Index data (C) and correlative sections: (A) Laskar 2010d solution (21); (B) Bristol Channel (United Kingdom); (C) Junggar Basin (China); (D) the Newark–Hartford astrochronology and geomagnetic polarity time scale (APTS). The thick red bar indicates the interval of extinctions and uncertainty of correlations between the sections, and the green arrows indicate the last appearance of L. rhaeticus (SI Text). A and B are adapted from refs. 19 and 31 (potential error added from ref. 21); D is modified from refs. 25 and 26. Note the difference in phase between the phasing eccentricity cycles in the La2010d solution (selected by ref. 31 for comparison with B) and the geological data that we attribute to chaotic drift; therefore, we have retained the independent times scales for both A and D.
