
Figure 8.
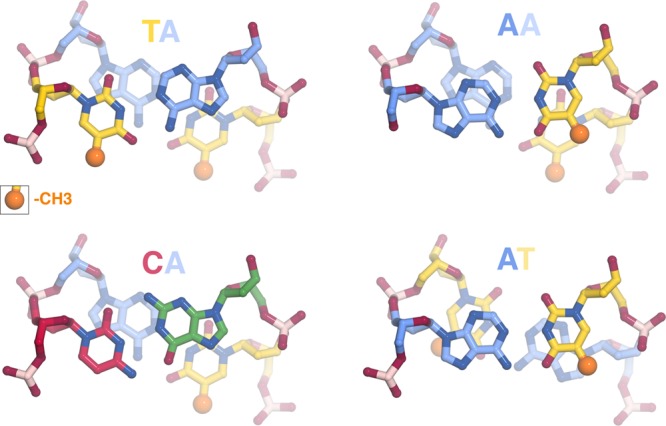
Minimal base stacking in TA and CA compared to other base pair steps. TA, CA, AA, and AT base pair steps colored as follows: T = yellow, A = blue, G = green, C = red. The thymine methyl groups are shown highlighted in space-filling representation (dark yellow), all other non-hydrogen atoms shown in sticks representation. The minimal base stacking and the absence of atoms close to the thymine methyl group permit greater flexibility of the TA and CA base pair steps.