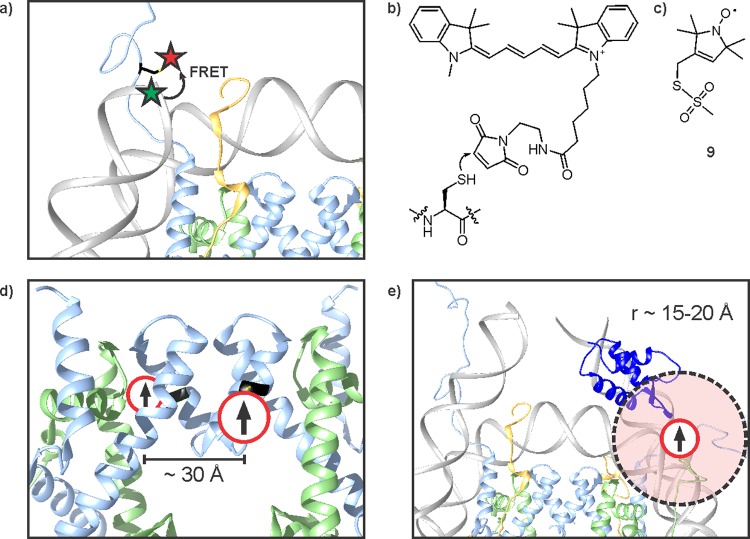
Figure 28.
Spectroscopic characterization of nucleosomes and histones. (a) FRET assay to investigate DNA breathing. DNA (gray) is labeled with Cy3 (green star), H3 V35C (black), with Cy5 (red star). DNA unwrapping increases the distance between the fluorophores, leading to a loss in FRET signal. (b) Structure of cysteine-reactive Cy5-maleimide. (c) Structure of the MTSL spin label. (d) Distance measurement with PELDOR between spin labels (arrow) installed at H3Q125C. H3 is drawn in blue, H4 in green. (e) Asymmetric positioning of H1 (blue) on the nucleosome core particle. A spin label (arrow) placed at H3K37C perturbs NMR signals in its vicinity (dashed sphere).

