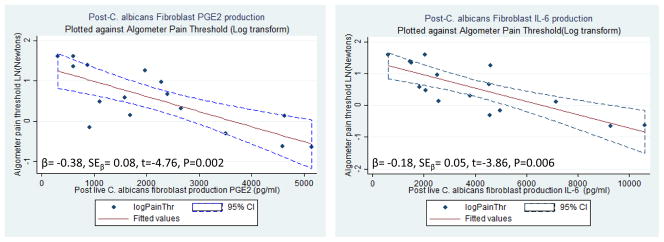
Figure 3.

Scatterplots with fitted values and 95% CI’s (dotted) for PGE2 (Fig 3a.) and IL-6 (Fig 3b.) production versus mechanical pain threshold (Log Transform)
Scatterplots of fibroblast production of PGE2 (right graph) and IL-6 (left graph) plotted against log transform of mucocutaneous pain threshold, done prior to tissue sampling, from the identical anatomic sites (N=16). Central line represents fitted values of linear regression delimited by 95% confidence intervals (dotted lines).
