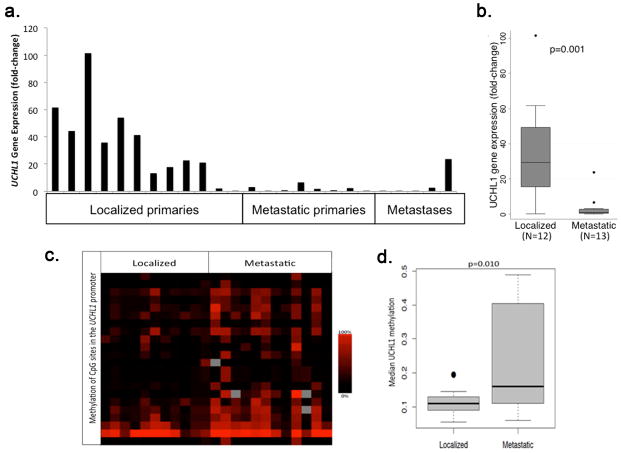
Figure 1.
(A) UCHL1 gene expression in a group of 25 GEP-NETs, including 12 localized primary tumors, eight metastatic primary tumors, and five distant metastases. (B) Boxplot showing that the median UCHL1 transcript level in metastatic tumors and metastases was significantly lower than in localized tumors (p=0.001). (C) Heat map depicting hyper-methylation of many CpG sites (y-axis) around the UCHL1 promoter of metastatic tumors compared to localized tumors. (D) Boxplot showing that the median frequency of methylation among the variable CpG sites in metastatic tumors and metastases was significantly greater than among localized tumors (p=0.010).

