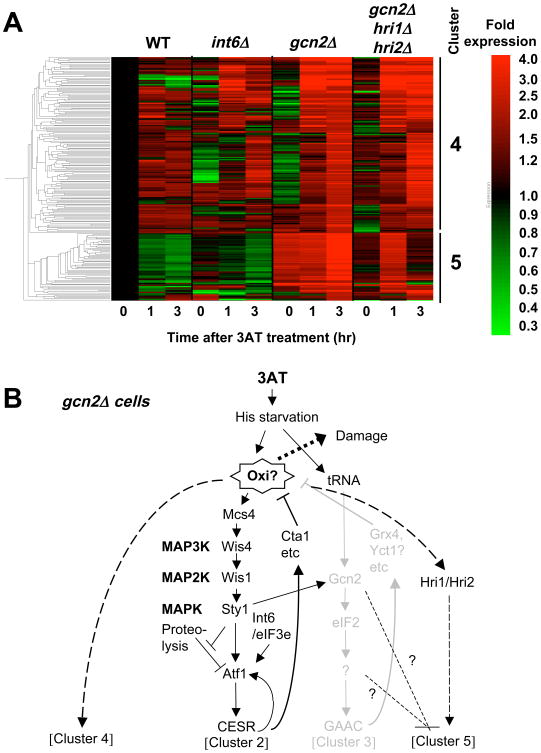
Fig. 8. Genes induced by 3AT specifically in the absence of gcn2+.
(A) Clustering of 217 genes induced <2-fold in wild-type and >2-fold by 30 mM 3AT in gcn2Δ cells 12, with the level of expression presented by the red/green scale bar to the right. Each column represents expression level of the genes in yeast carrying mutations indicated across the top after 3AT treatment for the time shown on the bottom. Bars and numbers to the right indicate the gene cluster identified. (B) Model of gene regulation within gcn2Δ cells. Black and gray drawings indicate the pathways proposed to operate or shut down, respectively, in the cells. The model states that the absence of Gcn2 generates oxidative damage (Oxi?), which in turn induces clusters 4 and 5, with the latter repressed by gcn2+ and stimulated by hri1+/hri2+.

