
Fig. 9. Sty1 MAPK stimulates Gcn2 phosphorylation of eIF2α.
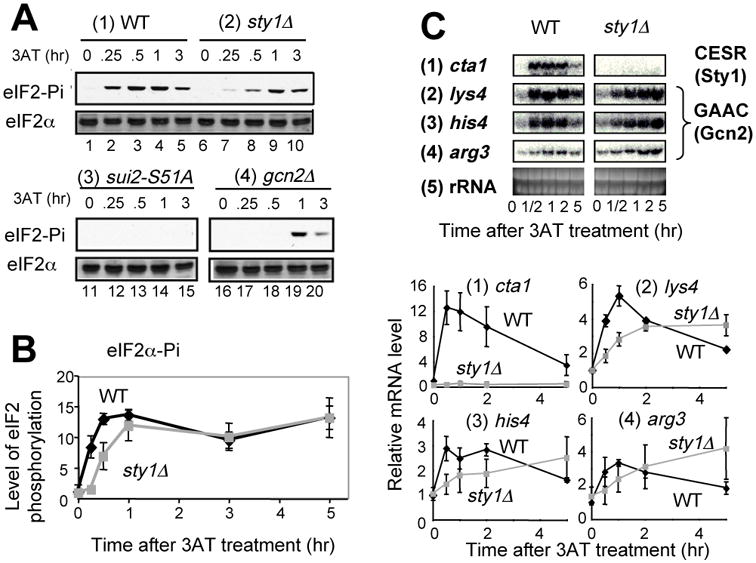
(A) eIF2 phosphorylation: Strains KAY641 (panel 1), KAY640 (panel 2), JP436 (panel 3), and KAY406 (panel 4) were grown in EMM-C-his to an early exponential phase and then 30 mM 3AT was added. Cells were harvested, and protein lysates were prepared and analyzed immunoblotting with anti-phospho eIF2α (top panel) or total eIF2α (bottom panel) antibodies, as described 9. (B) The graph shows the relative levels of phospho-eIF2α, normalized for total eIF2α levels in the wild-type (black symbols) or sty1Δ (gray symbols) cells used in (A). The values are compared to the ratio calculated for wild-type at time 0. Bars indicate the SD (n=3 or more). (C) 3AT-induced transcript level changes were examined in strain KAY641 (wild-type) and KAY640 (sty1Δ) for the genes indicated to the left, as described in Fig. 1.