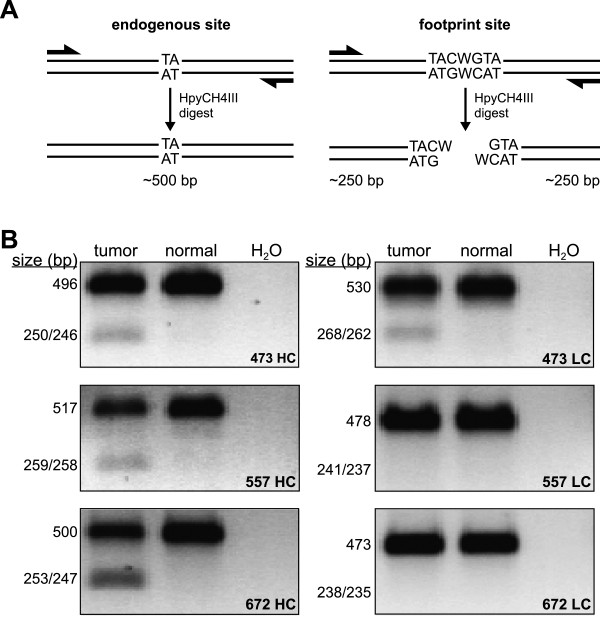
Figure 1.

Validation of candidate SB-induced footprint sites identified by deep-sequencing analysis. (A) Schematic diagram depicting the method used to validate putative footprints. Primers were designed to amplify genomic regions predicted to contain SB-induced footprints in DNA from tumor samples, but not in DNA from normal tissue. Products amplified from tumor and normal DNA were purified and subjected to enzymatic digest with HpyCH4III, a restriction endonuclease whose recognition site is generated following SB transposon excision. (B) Digested products were separated by agarose gel electrophoresis. Results from a high confidence (HC) and low confidence (LC) predicted footprint are shown for each of the three tumors analyzed. Undigested products range in size from 473–530 bp (upper bands), while digested products range in size from 235–268 bp (lower bands).
