Figure 3.

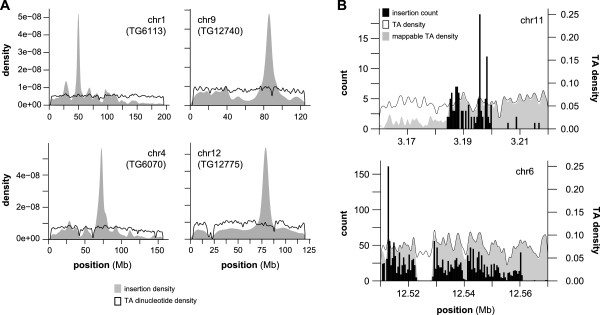
Transposon insertion densities on local chromosomes and non-local windows. (A) The transposon insertion site and TA dinucleotide densities are shown for each chromosome that undergoes local hopping. In each case, the height of the peak indicates the proportion of total events present at that location. The strongest single peak on each chromosome corresponds to the mapped location of the indicated transgene (e.g. TG6113). (B) Two genomic regions identified by PRIM analysis show enrichment for transposon insertion: chr11:3,180,001-3,200,000 (top) and chr6:12,510,001-12,570,001 (bottom). In each case, a histogram plot indicates the number of insertion events present at each location (left axis). The density plot indicated by the solid line shows the proportion of total TA dinucleotides (right axis). The density plot represented by the shaded curve represents an estimate indicating the proportion of TA sites in which more than 50% of read lengths can be accurately mapped (see Methods).
