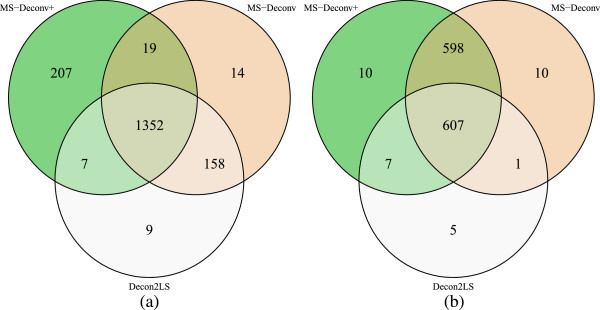
Figure 6.

Comparison of Decon2LS, MS-Deconv, and MS-Deconv+ on spectral identification by coupling them with MS-Align+. The numbers of tandem mass spectra identified from the EC HCD and ETD data sets by the three methods with 1% protein level FDR are compared. (a) The EC HCD data set. (b) The EC ETD data set.
