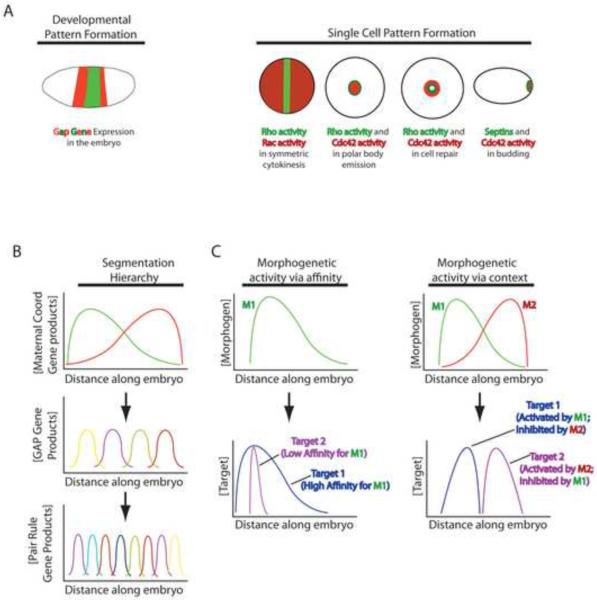
Figure 1.
Basic mechanisms underlying developmental and single cell pattern formation. A. Left: schematic showing stripe-like expression of different GAP genes in a Drosophila embryo. Each stripe will give rise to subsidiary stripes of gene expression and will ultimately direct the formation of a particular segment of the animal. Right: schematic showing examples of single cell pattern formation. For cytokinesis and wound healing, Rho activity zones shown in green and Rac or Cdc42 activity zones shown in red; each zone will specify a different part of the F-actin and myosin-2 arrays that form during cytokinesis and wound repair. For budding septins are shown in green and Cdc42 patch in red; each directs formation of a different region of the incipient bud. B. Stylized representation of the gene expression hierarchy in Drosophila segmentation. Each line represents the gradient of distribution of a particular gene product along the anterior (left)-posterior (right) axis of the embryo. Thus, the maternal coordinate gene product represented by the green line is in a gradient with its peak concentration near the anterior pole of the embryo. The maternal effect gene products form long range gradients that control the expression of the GAP genes, which are expressed in shorter range gradients and which control the expression patterns of the pair rule genes. Ultimately, the hierarchy results in the formation of distinct segments along the anterior-posterior axis of the embryo. C. Schematic representing two proposed mechanisms by which gradients of morphogens act in a qualitative manner. The red and green lines (M1 and M2) represent morphogen gradients; the blue and purple lines (target 1 and target 2) represent targets of the morphogen gradients. In morphogenetic activity via affinity, the low affinity target of M1 is only activated where the concentration of M1 is highest, while the high affinity target of M1 is activated proportionally along the entire M1 gradient. In morphogenetic activity via context, two overlapping morphogen gradients define the activity of targets. The activity of Target 1, which is activated by M1 and inhibited by M2 is confined to a narrow region within the M1 gradient while the activity of Target 2, which is activated by M2 and inhibited by M1 is confined to a narrow region within the M2 peak.

