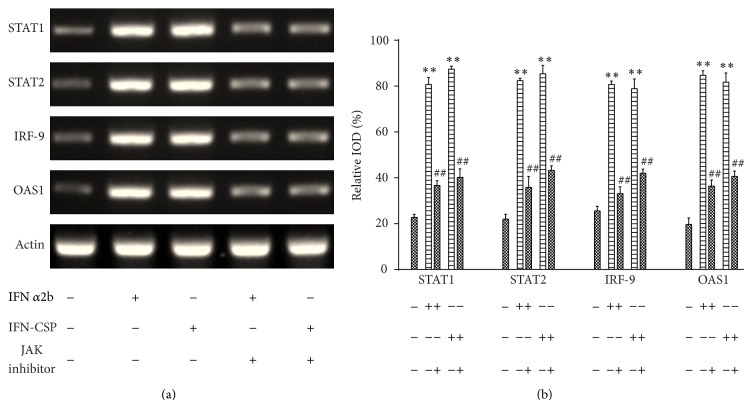
Figure 3.
Stimulation of IFN-CSP on the mRNA expression of STAT1, STAT2, IRF-9, OAS1, and blockade by JAK inhibitor. Confluent HepG2.2.15 cells were pretreated for 1 h with JAK inhibitor or not and then incubated with either IFN-CSP or IFNα2b for 3 days. The levels of STAT1, STAT2, IRF-9, and OAS1 mRNA were assayed by RT-PCR (a), and the β-actin gene was used as an internal control. The corresponding relative integrated optical densities (IOD) of the gene band were analyzed using Image-Pro Plus (IPP) software (b). Data are the mean ± SEM of three experiments. ** P < 0.01 versus untreated controls and ## P < 0.01 versus no JAK inhibitor controls.

