Figure 4.

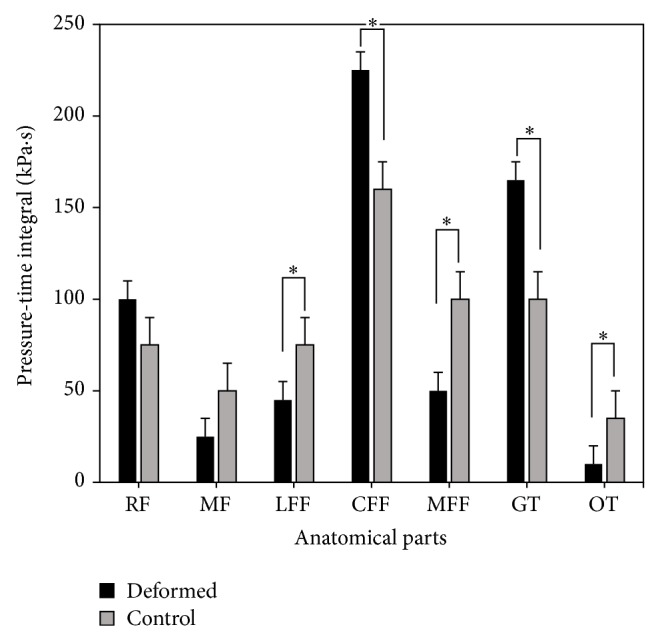
Pressure-time integral comparison between the fifth-toe deformed group and control group (∗significant difference, P < 0.05).

Pressure-time integral comparison between the fifth-toe deformed group and control group (∗significant difference, P < 0.05).