
Figure 4.
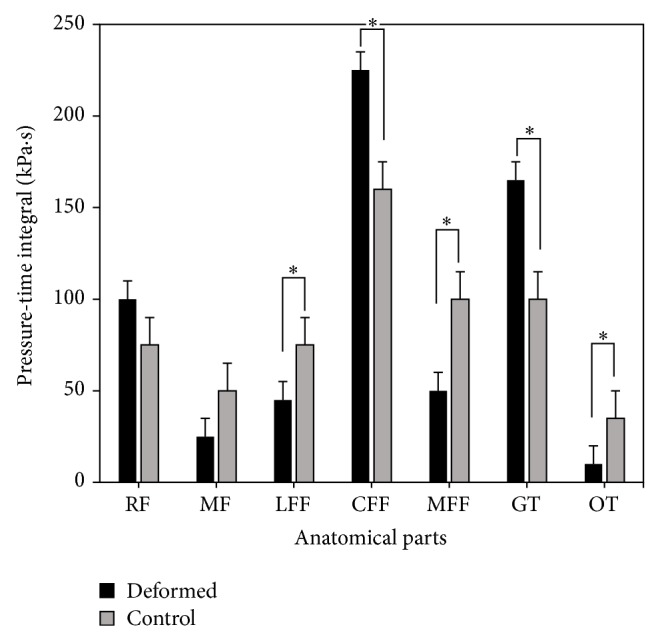
Pressure-time integral comparison between the fifth-toe deformed group and control group (∗significant difference, P < 0.05).
Official websites use .gov
A
.gov website belongs to an official
government organization in the United States.
Secure .gov websites use HTTPS
A lock (
) or https:// means you've safely
connected to the .gov website. Share sensitive
information only on official, secure websites.
Pressure-time integral comparison between the fifth-toe deformed group and control group (∗significant difference, P < 0.05).