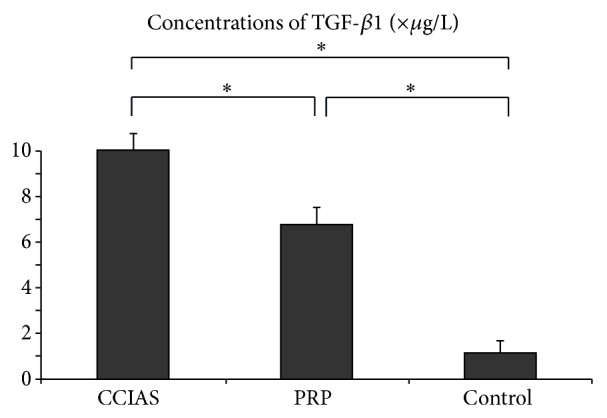
Figure 3.

Concentrations of TGF-β1 in PRP, CCIAs, and control groups. TGF-β1 concentrations in PRP group (n = 6), CCIAs group (n = 6), and control group (n = 6) were measured. The data were expressed as the mean ± error and evaluated by one-way ANOVA. * P < 0.05, with a statistical significance between two groups.
