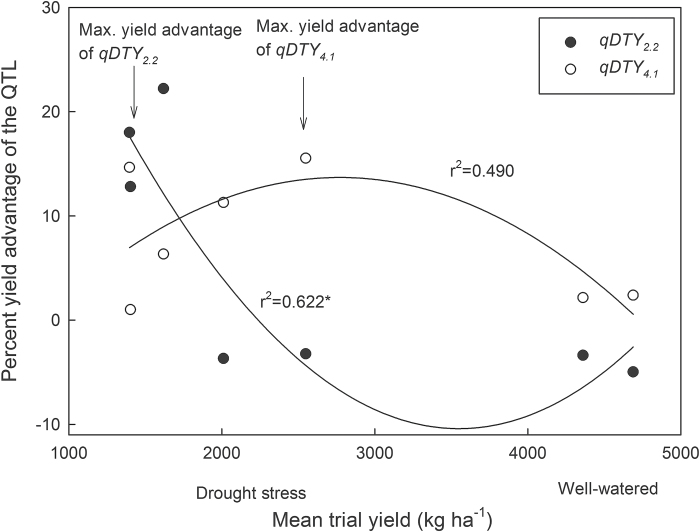
Fig. 1.
Percent advantage of qDTY 2.2 and qDTY 4.1 under varying severities of drought stress across seven experiments conducted with the IR77298-14-1-2 × IR64 population. Each point represents the difference between +QTL and –QTL lines in one field study. The total number of lines (+QTL, –QTL, and heterozygotes) ranged from 134 to 288 in each study. The significance of the curve fitting by non-linear regression is indicated: *, P < 0.05. The significant interaction between the qDTY category and the quadratic term, P-value [(Mean*Mean*qDTY) = 0.036], indicates a difference between the curves.

