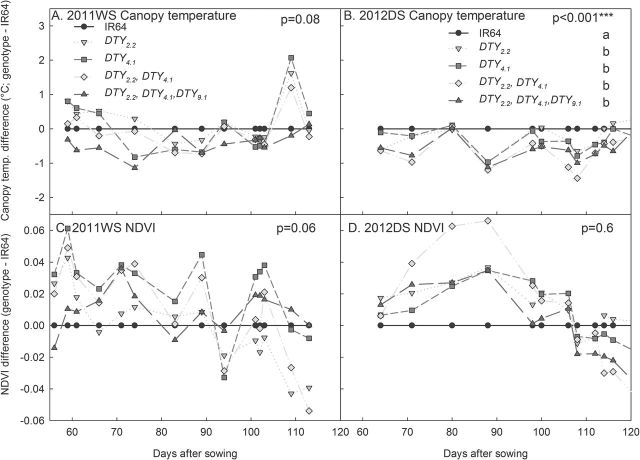
Fig. 3.
Response of different AdaySel-derived QTL combinations in NILs in the background of IR64. (A, B) Canopy temperature difference from IR64. (C, D) NDVI. Each point represents the mean of 2–3 genotypes with that QTL combination. The presence of qDTY 10.1 is not presented here, and other QTL-combination NILs were omitted for simplicity. P-values shown are for genotypic differences across the experiment as determined by the mixed model ASREML.

