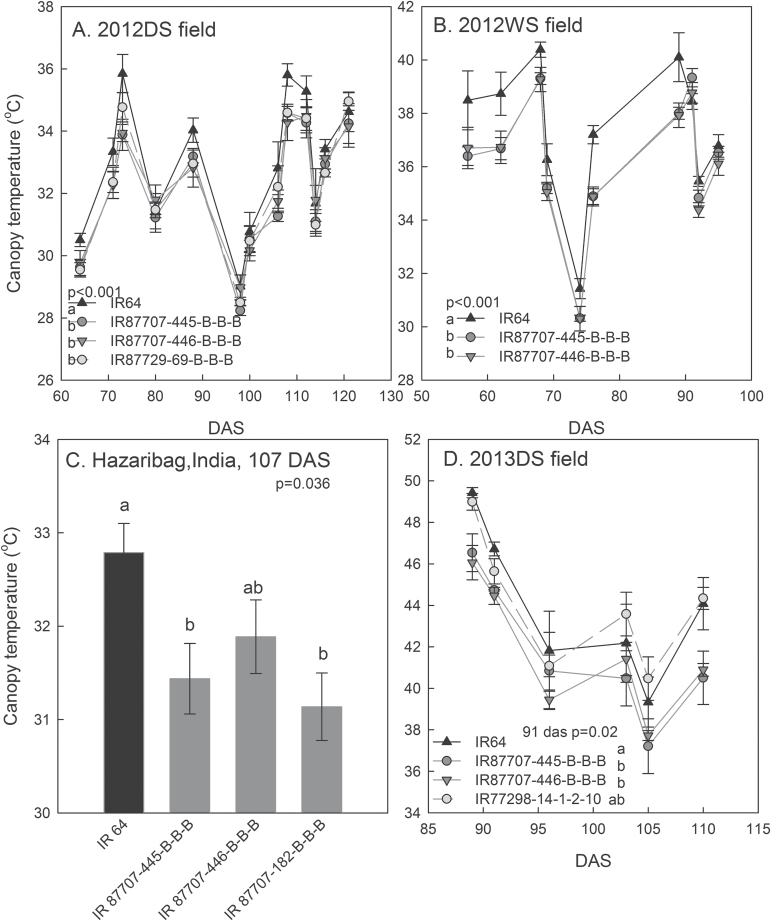
Fig. 4.
Canopy temperature across four field drought experiments. The canopy temperature was significantly lower in 2-QTL NILs across seasons in (A) 2012DS and (B) 2012WS, and (C) at 107 DAS in Hazaribag, India, and (D) at 91 DAS in 2013DS. The 4-QTL NIL (A) and +QTL BIL (D) also showed lower canopy temperature than IR64. Values shown are mean ± SE, and letters indicate significant differences among genotypes as determined by LSD comparison (P < 0.05). P-values shown are for genotypic differences across the experiment as determined by the mixed model ASREML. IR64 is indicated by a black line/bar, and the 2-QTL NILs are indicated by dark grey lines/bars.

