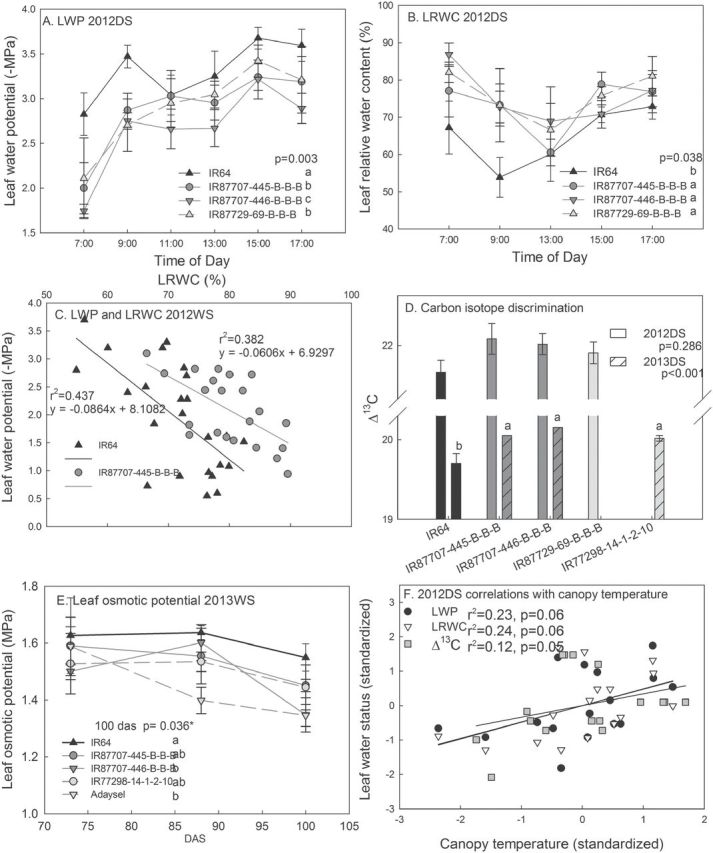
Fig. 5.

Leaf water status in the drought-stress treatment indicated a greater degree of hydration according to (A) leaf water potential over the course of the day (88 DAS), (B) leaf relative water content over the course of the day (88 DAS), (C) the relationship between LWP and LRWC in rewatered leaves from the field drought treatment that were dehydrated to different levels (90–91 DAS), (D) carbon isotope discrimination (79 DAS in 2012DS, 114 DAS in 2013DS), and (E) leaf osmotic potential. (F) Standardized leaf water status parameters correlated with standardized canopy temperature in 2012DS (sign changed for LRWC values). Values shown are mean ± SE, and letters indicate significant differences among genotypes as determined by LSD comparison (*, P < 0.05). P-values shown are for genotypic differences across the day (A and B) as determined by the mixed model ASREML. IR64 is indicated by a black line, and the 2-QTL NILs are indicated by dark grey lines in panels A–E.
