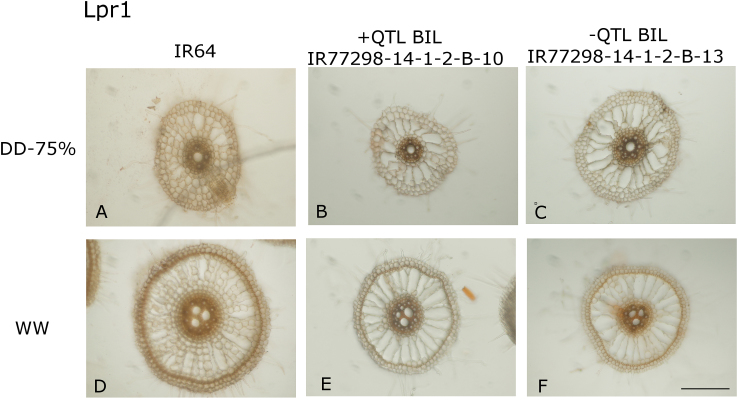
Fig. 7.
Root anatomy differences between + and –QTL BILs in terms of root and xylem diameter when measured at 2cm from the root tip in greenhouse studies. Images on top are from the DD-75% treatment and images on the bottom are from the WW treatment. Genotypes shown are IR64 (A) DD-75% and (D) WW, +QTL BIL IR77298-14-1-2-10 (B) DD-75% and (E) WW, and –QTL BIL IR77298-14-1-2-13 (C) DD-75% and (F) WW. All images are shown at the same scale, which was a magnification of ×100, and the bar in panel (F) represents 200 µm.

