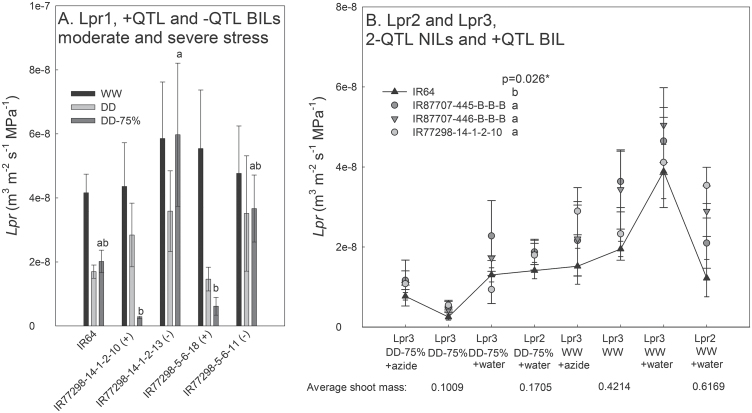
Fig. 8.
The Lp r in three studies. Treatments included WW, DD, and DD-75%. (A) Experiment Lpr1 on BILs, in which no plants were rewatered before the Lp r measurement. (B) Experiments Lpr2 and Lpr3 on 2-QTL NILs and the +QTL BIL: when indicated, plants in the DD-75% treatment were rewatered before the Lp r measurement (water or azide). Experiments are listed in order of average shoot mass, reflecting the level of drought severity. Values shown are mean ± SE, and letters indicate significant differences among genotypes as determined by LSD comparison (*, P < 0.05).

