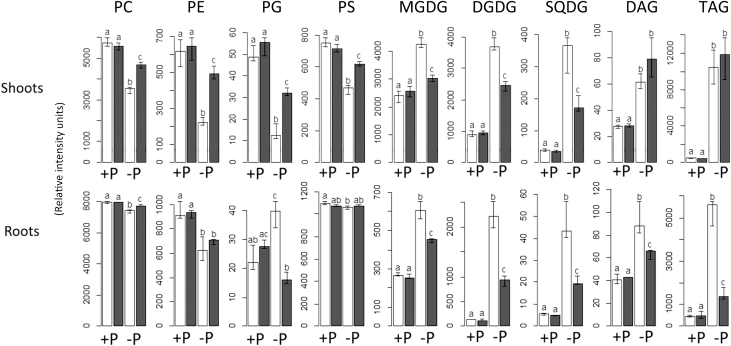
Fig 1.
The change in lipid composition induced by P starvation is strongly influenced by the transcription factor PHR1. Values shown are the total content for each class in each condition. White bars represent wild-type plants and black bars represent phr1 mutants. Units shown are relative and represent normalized intensities. The height of the bars indicates the median value. Error bars represent the interval between the first and the third quartiles. Letters (a–c) indicate statistical groups according to pairwise t-tests.

