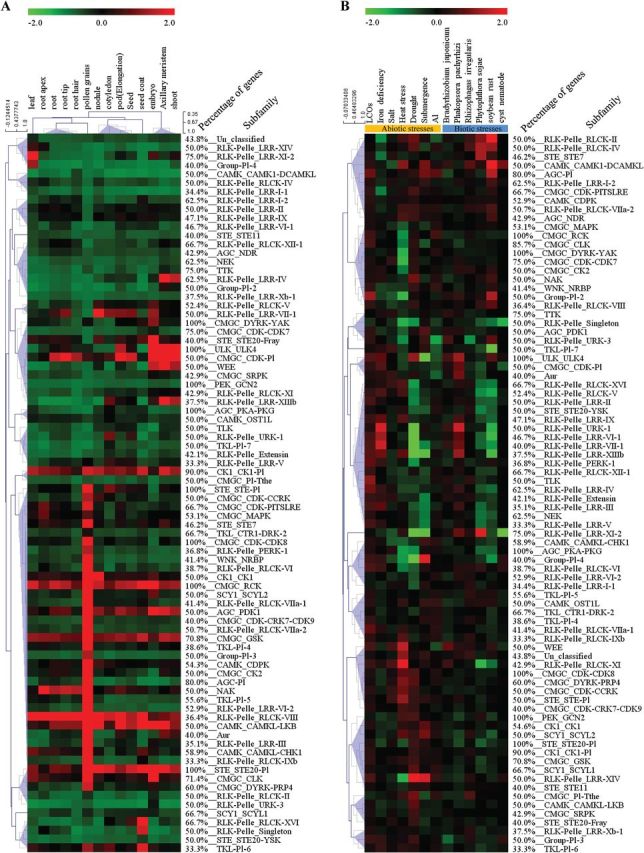
Fig. 6.

Heat maps of the expression patterns of soybean PK subfamilies in different tissues and under various biotic and abiotic stress conditions. The expression patterns of 82 PK subfamilies in different tissues (A) and under various biotic and abiotic stress conditions (B) are shown. The heat maps were generated using MeV software, v. 4.9. A colour scale corresponding to upregulation and downregulation is shown. (This figure is available in colour at JXB online.)
