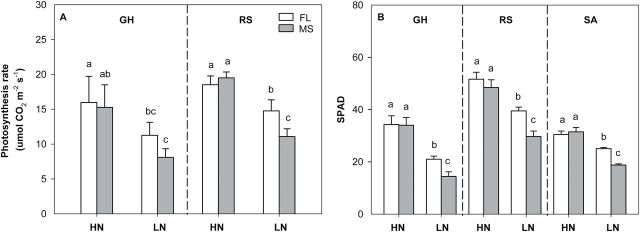
Fig. 10.
Photosynthesis rate (A) and SPAD (B) readings under high-N (HN) and low-N (LN) conditions at 42 days after planting in GH mesocosms and at anthesis in the field in RS and SA. The data shown are means of four replicates of the nine (GH) and five (RS and SA) genotypes in each phenotype in either HN or LN ± SE. Different letters represent significant differences (P < 0.05) compared within each location.

