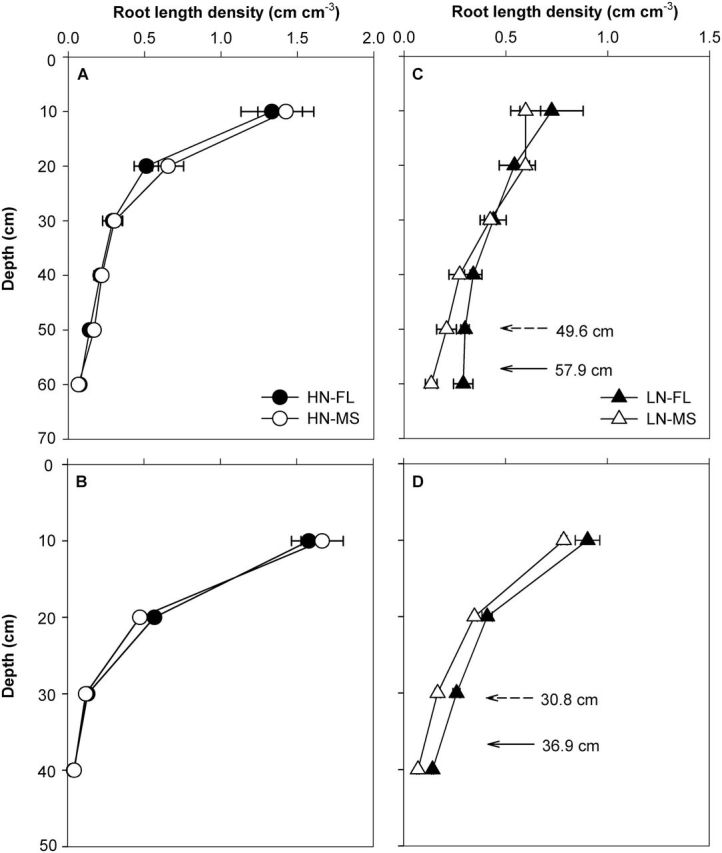
Fig. 7.

Root length density of maize lines at anthesis in the field in RS (A, C) and SA (B, D) under high N (HN, circle) and low N (LN, triangle) for five FL (filled symbols) and five MS (open symbols) genotypes. The data shown are means of four replicates of the five genotypes in each phenotype in either HN or LN ± SE. The value of D95 for five FL (solid arrow) and 5 MS (dashed arrow) genotypes are shown in the LN panel (C and D).
