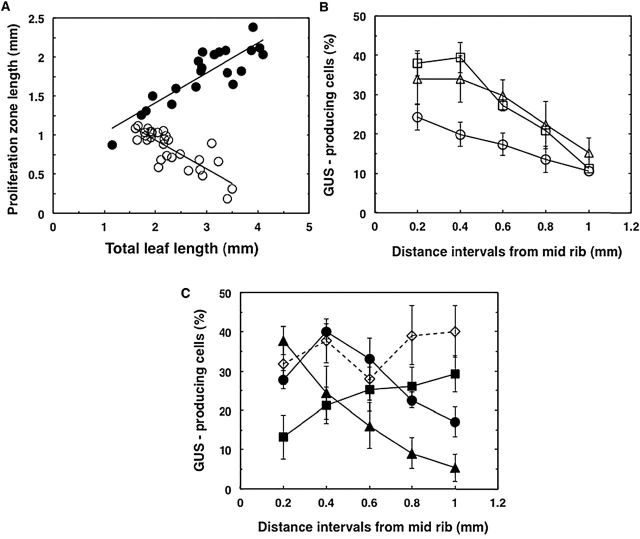
Fig. 4.
Cell proliferation dynamics along the orthogonal axes of young leaves. (A) Length of proliferation zone plotted against total length of Col-0 (open circles) and tni (filled circles) leaves. Each data point represents a measurement from a single leaf. A straight line was fitted to the data points (R 2 is 0.67 for Col-0 and 0.76 for tni) and the slope values for Col-0 and tni were –0.37 and +0.43mm–1, respectively. (B, C) Percentage of GUS-producing cells in the transition zone (refer to Supplementary Figure S1) is plotted against distance from midrib to margin of Col-0 (open circles), arf2-8 (open squares), and klu-4 (open triangles) (in B) and of tni (filled circles), jaw-D (filled squares), Δppd (filled triangles), and tni jaw-D (open diamonds) (in C). 100–150 pavement cells were counted per data point per region of leaf. Mean values of 11 leaves in Col-0 and five leaves for other genotypes are shown. Leaf length varied from 1.7 to 2.2mm (Col-0 and klu-4), 2.3 to 2.8mm (tni), 2.8 to 3.3mm (jaw-D), 1.9 to 2.6mm (Δppd and arf2-8), and 3.2 to 4.0mm (tni jaw-D). The mitotic arrest front was at ~one-third of the leaf length from the tip when the analysis was carried out. Error bars are SEM.

