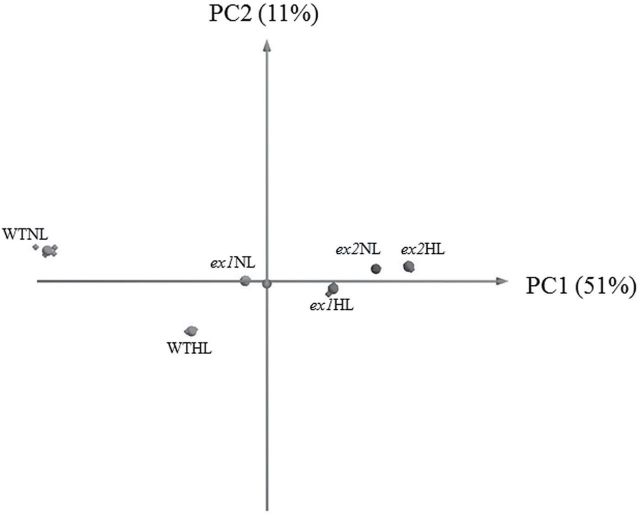
Fig. 1.
A principal component analysis (PCA) biplot for the complete data set demonstrated a distinct clustering of WT from the executer mutants (ex1 and ex2) in the two light treatments (NL and HL). Principal components 1 (PC1) and 2 (PC2)—where PC1 indicates the direction of the highest variability followed by PC2 with diminishing variability orthogonal to PC1—accounted for 51% and 11% of the study variance, respectively. PCA suggested a modification of the soluble chloroplast proteome in Arabidopsis upon light treatment. The genotype caused a large shift in the PC1 dimension to more positive values and significantly reduced the differences between NL and HL samples in PC2.

