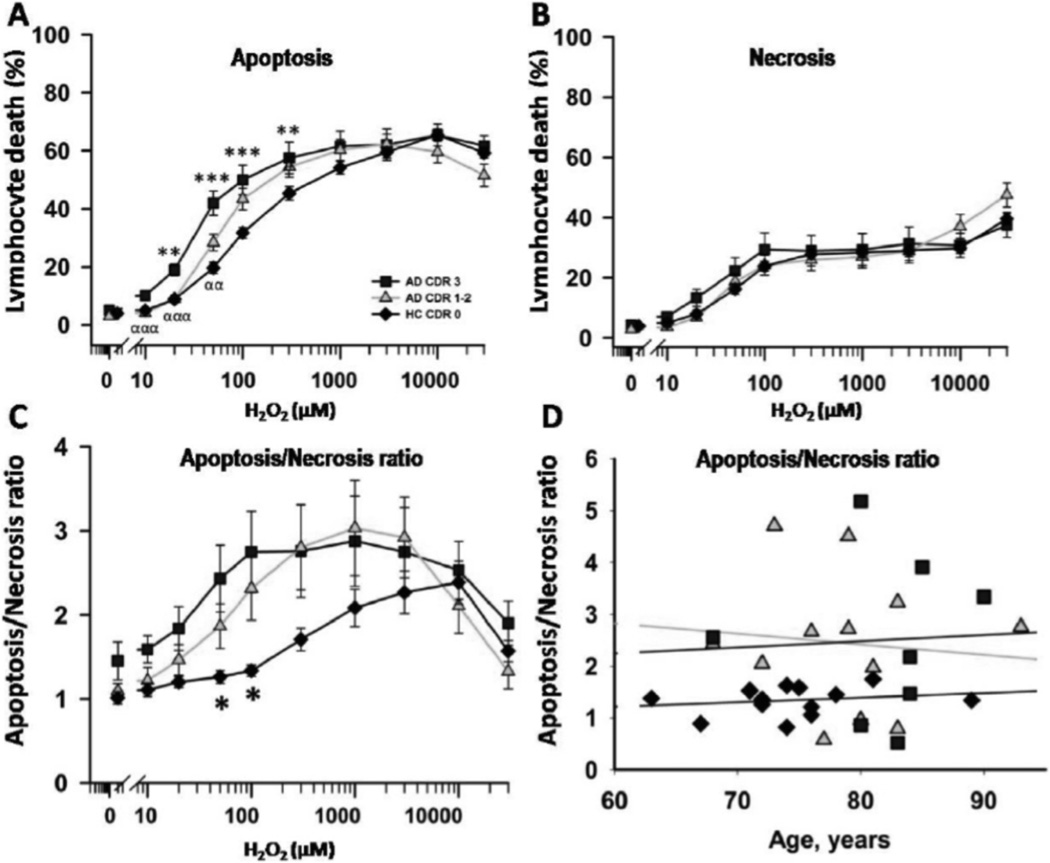
Fig. (2).
Apoptotic/necrotic ratios after H2O2-induced death of peripheral lymphocytes. A and B: Apoptosis and necrosis values measured in the experiments in Fig. (1A). C: Apoptosis/necrosis ratios calculated at each H2O2 concentrations in the three groups of patients (mean ± SEM). D: Apoptosis/necrosis ratios of individual participants in the three groups plotted against age. Symbols as in Fig. (1A).

