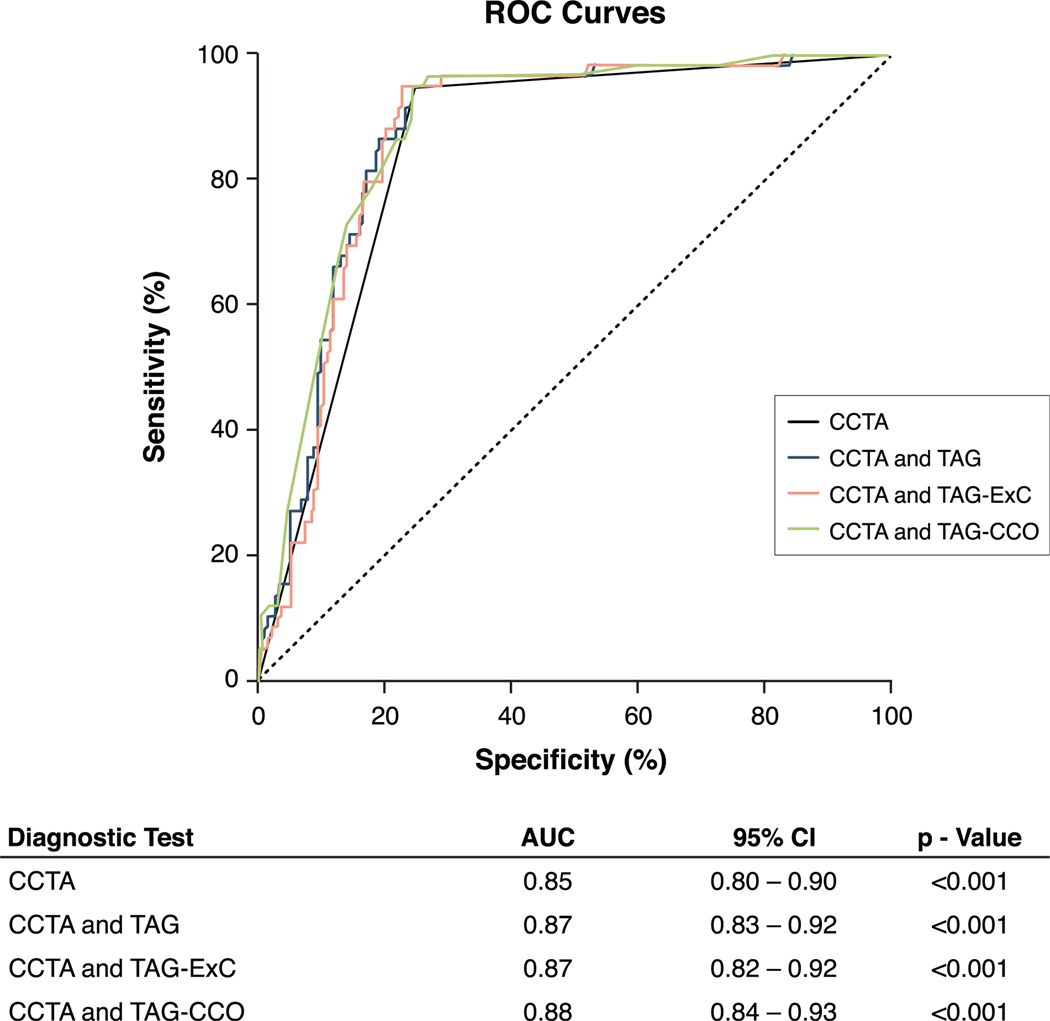
Figure 4. Diagnostic Performance of Coronary CTA Alone and With TAG, TAG-ExC, and TAG-CCO.
Receiver-operating characteristic (ROC) curve analysis with corresponding area under the curve (AUC) and 95% confidence interval (CI) displaying the diagnostic performance of coronary CTA, coronary CTA and TAG, coronary CTA and TAG-ExC, and coronary CTA and TAG-CCO for the detection of hemodynamically-significant coronary artery disease as indicated by FFR. Abbreviations as in Figure 1.

