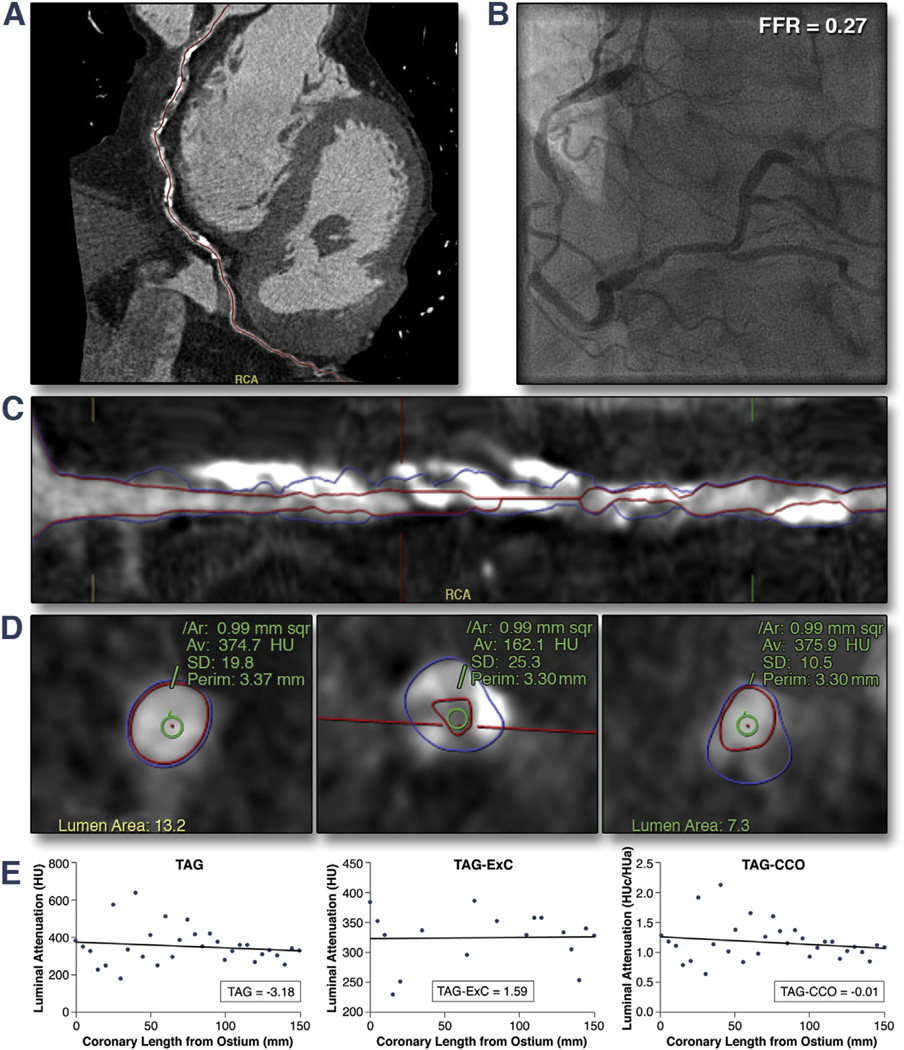
Figure 5. Example of TAG Analysis of a Highly-Calcified RCA.
Coronary CTA (A and C) and cross-sectional images with the region of interest indicated by the green circle (D), invasive coronary angiography with FFR (B), and TAG analyses (E) of a highly calcified right coronary artery (RCA) with a hemodynamically significant stenosis (FFR = 0.27). Note that TAG analyses were comparable and omission of calcified segments did not alter the results. In this patient, TAG did not show a decline in contrast density along the artery despite a severely compromised hyperemic distal pressure. Abbreviations as Figure 1.

