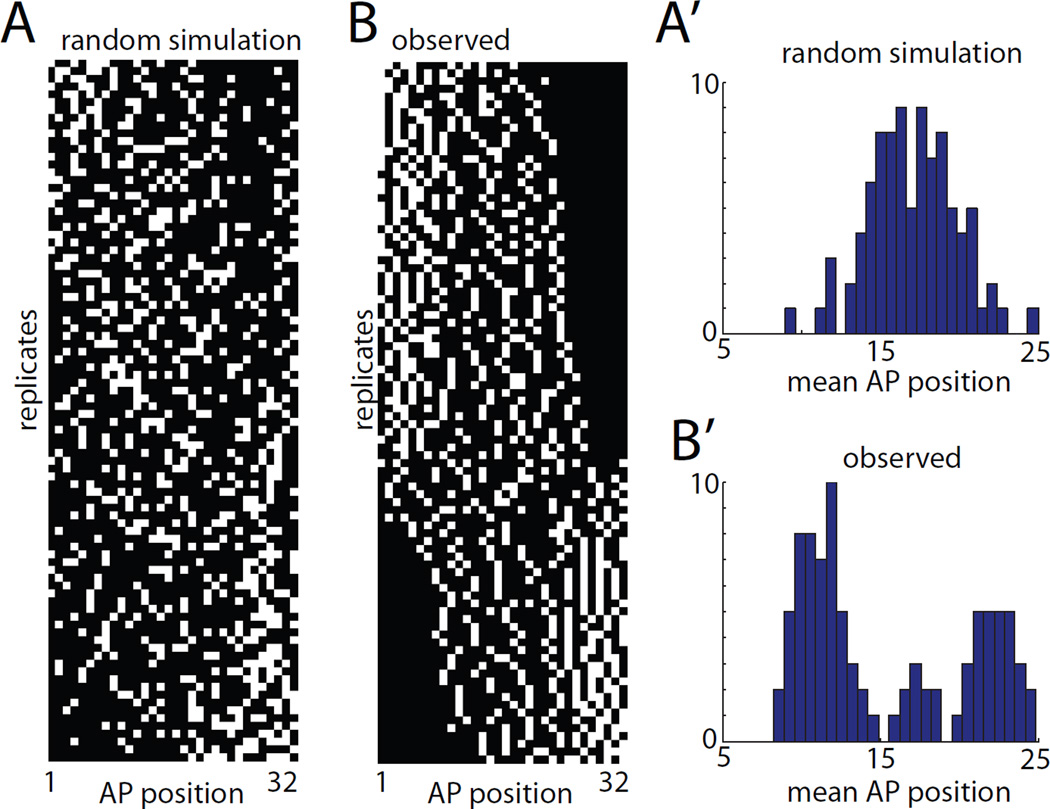
Figure 3. Analysis of primary 8-cell clones.
A) 8-cell mosaic expression patterns simulated under the hypothesis that notochord intercalation is completely random. B) Experimentally observed mosaic expression patterns in 90 embryos expressing GFP in 8/32 primary notochord cells. Different replicates are ordered from top to bottom by mean AP position. The AP axis of the notochord is shown from left to right. A’,B’) Histograms of mean AP position for the 8 labeled cells from the randomly simulated (A’) and experimentally observed (B’) data. The randomly simulated data is unimodal, whereas the experimentally observed data shows two large peaks and a smaller central peak.

