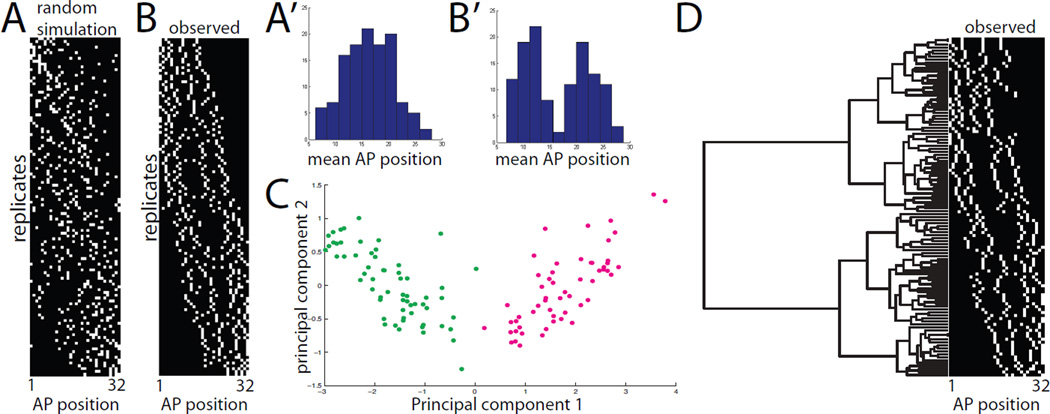
Figure 4. Analysis of primary 4-cell clones.
A) 4-cell mosaic expression patterns simulated under the hypothesis that notochord intercalation is completely random. B) Experimentally observed mosaic expression patterns in 120 embryos expressing GFP in 4/32 primary notochord cells. Different replicates are ordered from top to bottom based on mean AP position. The AP axis of the notochord is shown from left to right. A’,B’) Histograms of mean AP position for the 4 labeled cells from the randomly simulated (A’) and experimentally observed (B’) data. The randomly simulated data is unimodal, whereas the experimentally observed data is bimodal. C) Principal components analysis of the 120 experimentally observed 4-cell clones. The AP indices of the first, second, third and fourth cells in each 4-cell clone were used as 4 dimensions for PCA. The first two principal components were found to account for 98% of the sample variance. Two very distinct populations are obvious in the plot of PC1 versus PC2, but neither is obviously resolved into two subpopulations. D) Clustering analysis of experimentally observed primary 4-cell clones. The AP indices of the first, second, third and fourth cells in each clone were used as 4 dimensions for hierarchical UPGMA clustering using standardized Euclidean distances. Two deep branches are seen at the base of the tree corresponding to the two distinct classes of clone. Subsequent branching might represent differences based on cell lineage but might also represent different developmental possibilities.

