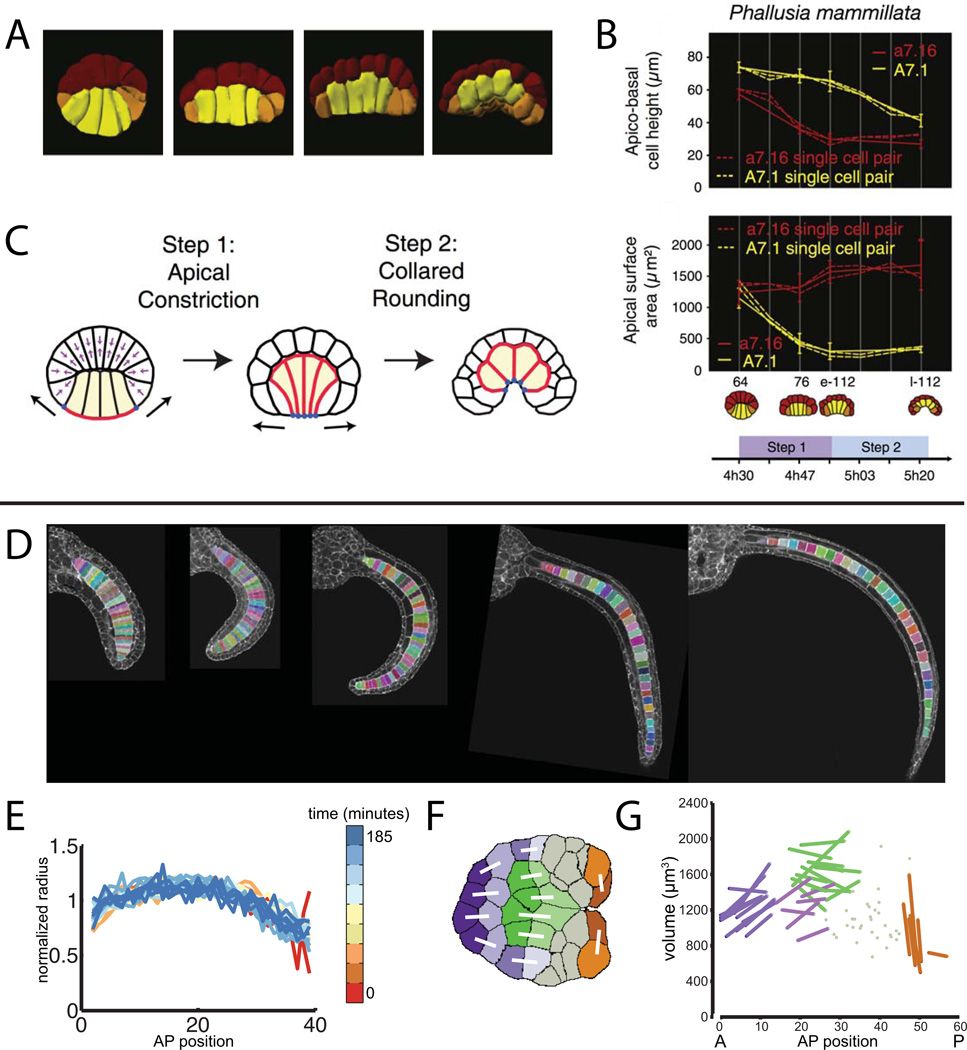
Figure 6. Integrative uses of quantitative in toto imaging to study endoderm invagination and notochord tapering.
A–C are from (Sherrard et al., 2011). A) Renderings of segmented embryos at successive time points during early gastrulation showing cell shape changes in the endoderm cells (yellow). B) Differential timing and extent of apical constriction and apical-basal shortening in endoderm cells (yellow) versus epidermal cells (red). C) Cartoon model of how early gastrulation is driven by a two step process involving first apical constriction and then subsequent apical-basal shortening. D-G are from (Veeman and Smith, 2012). D) Midvolume planes from confocal volumes of successive stages of notochord elongation. Segmented notochord cells are indicated with random pseudocolors. E) Normalized radius as a function of AP position for several stages of notochord elongation. Different timepoints (minutes after the end of notochord intercalation) are indicated with pseudocolors. F) Midvolume slice through a representative segmented Ciona notochord at the onset of mediolateral intercalation. Identified sibling pairs are connected with white lines. G) Notochord cell volumes as a function of AP position for three embryos segmented at the stage shown in F. Known sibling cells are connected by lines and colored according to the map in F.

