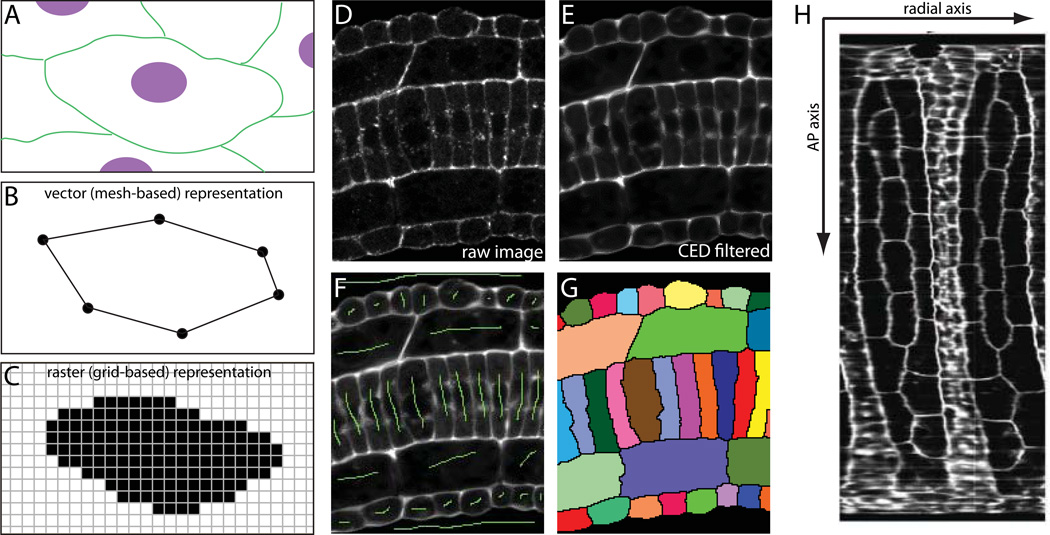
Figure 7. Embryonic cell segmentation.
A) Cartoon view of hypothetical cell membranes (green) and nuclei (magenta). B) Cell shapes can be represented in a vector format by lists of points connected by defined edges. C) Cell shapes can also be represented in a raster format by masks of pixels/voxels belonging to each cell. D) Raw confocal image of a section of Ciona tail. E) Preprocessing by membrane-enhancing CED filter. F) Hand-drawn seeds (green) for marker-assisted watershed segmentation. G) Watershed output with segmented cells labeled with random pseudocolors. H) Digitally ‘skinned’ embryo with the muscle/neural/endodermal strand cell layer flattened out to show the two blocks of muscle cells (large hexagonal/pentagonal cells) with neural cells between them (Abdollahian et al., 2011). One axis of this projection follows a curvilinear path along the AP axis. The other represents a radial axis around the embryonic mediolateral/dorsoventral midline.

