Figure 1 .

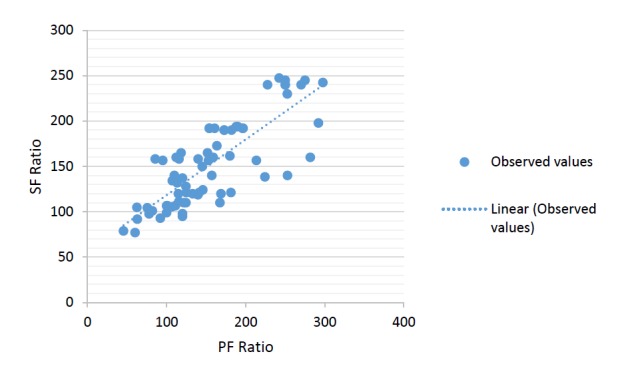
S/F ratio vs P/F ratio scatter plot for the derivation data set. The line represents the best fit linear relationship SF=57+0.61PF (P<0.001).

S/F ratio vs P/F ratio scatter plot for the derivation data set. The line represents the best fit linear relationship SF=57+0.61PF (P<0.001).