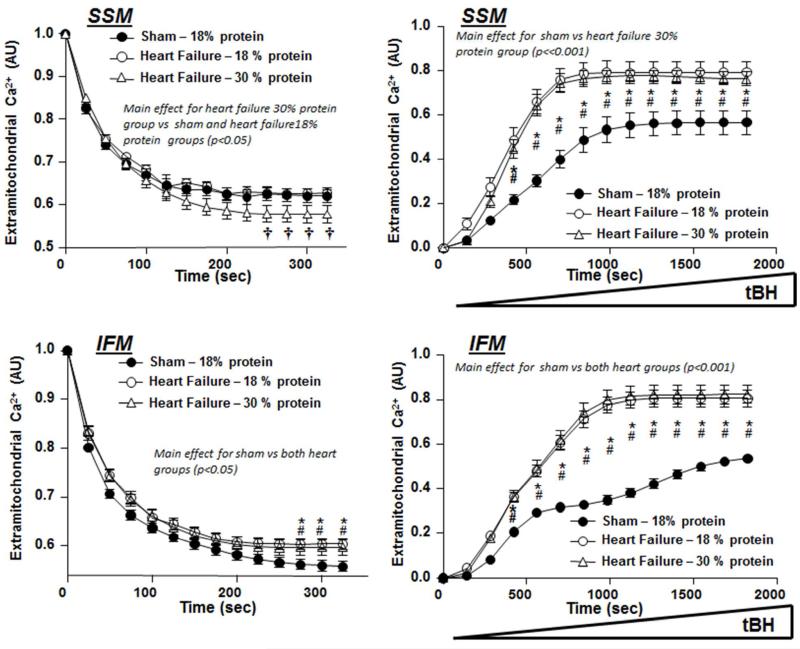
Figure 6.
Left Panels: Extramitochondrial Ca2+ concentration following an injection of 30 nmols Ca2+/mg mitochondrial protein at time = 0. Right Panels: Response of extramitochondrial Ca2+ concentration to a progressive rise in tert-butyl hydrogen peroxide (tBH), and index of ROS-induced MPT. Data are from Protocol 2 after 22 weeks of treatment. * denotes p<0.05 for heart failure with 18% protein compared to sham, # p<0.05 for heart failure with 30% protein compared to sham, † p,0.05 for the heart failure with 30% protein vs. both sham and 18% protein. The group sizes were 16 for the sham group, and 21 and 13 heart failure groups with 18% and 30% protein, respectively.

