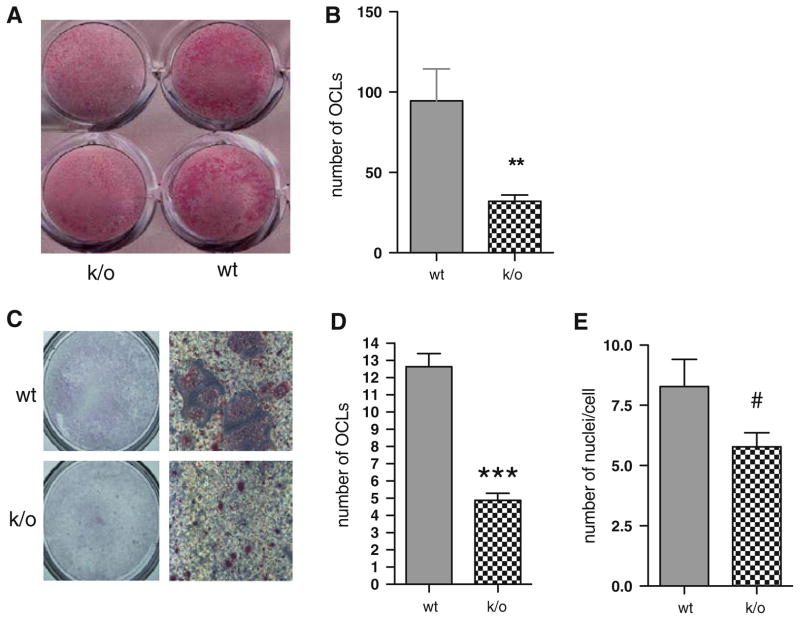
Fig. 6.
a TRAP stain of co-cultures prepared using wt marrow and osteoblasts isolated from k/o (plates on the left) or wt (plates on the right) mice. b Numbers of TRAP-positive multinucleated OCLs formed in the co-cultures. The mean values were 95 ± 20 versus 32 ± 4 per well; wt vs. k/o, respectively. The results shown are the M ± SEM of three independent experiments with each determination performed in duplicate. **P < 0.01. c Numbers of TRAP-positive multinucleated OCLs generated for each genotype from osteoclast precursors cultured under osteoclastogenic conditions. d Mean values for the experiment shown panel C were 12.6 ± 0.8 versus 4.9 ± 0.4 cells per 130 mm2; n = 25 for both genotypes; ***P < 0.001. e Number of nuclei per cell; 8.3 ± 1.1 versus 5.8 ± 0.6, wt versus k/o; n = 18 for both genotypes; #P = 0.06

