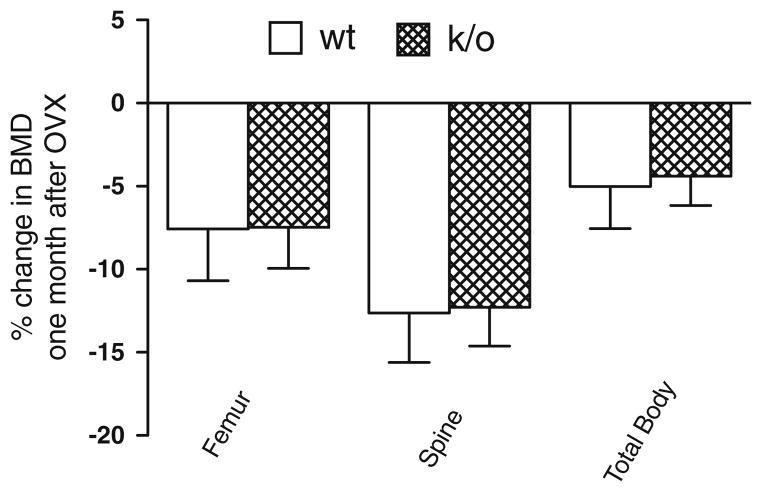
Fig. 7.
Percent change in BMD in k/o and wt mice 1 month following OVX. BMD was reduced to similar extent in k/o and wt mice after OVX. The changes in femur, spine and total body BMD in wt mice compared so sham OVX wt mice were: −7.6, −12.6 and −5, respectively. Similar changes were observed in the OVX k/o mice compared to their sham OVX controls with declines of −7.5, −12.3 and −4.4% at the femur, spine and total body (P = NS for the difference by genotype at each site.)

