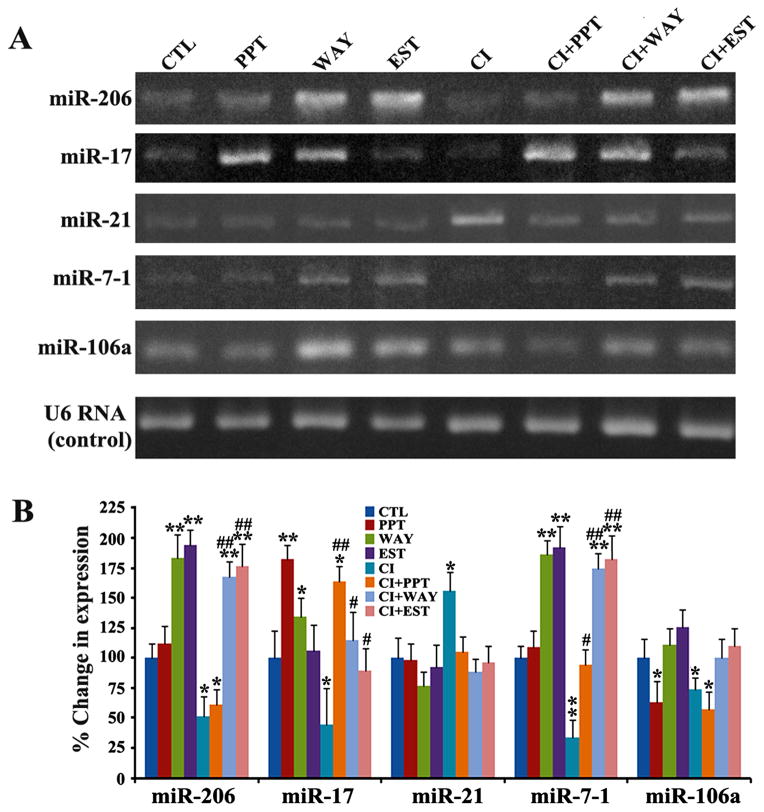
Fig. 3.
Qualitative RT-PCR and real-time qRT-PCR to determine levels of specific miRs in VSC4.1 motoneurons. Treatment groups (24 h): control (CTL), 50 nM PPT, 100 nM WAY,150 nM EST, 200 nM CI, 200 nM CI + 50 nM PPT, 200 nM CI +100 nM WAY, 200 nM CI + 150 nM EST. (A) Qualitative RT-PCR products of miRs were resolved by 2.2% agarose gel electrophoresis. (B) Real-time qRT-PCR products were analyzed for levels of expression of miRs after normalizing with U6 RNA. Difference in values between CTL and a treatment was considered significant at *p<0.05 or ** p<0.01. Difference in values between the CI treated cells and the CI + ER agonist treated cells was considered significant at #p<0.05 or ##p <0.01.

