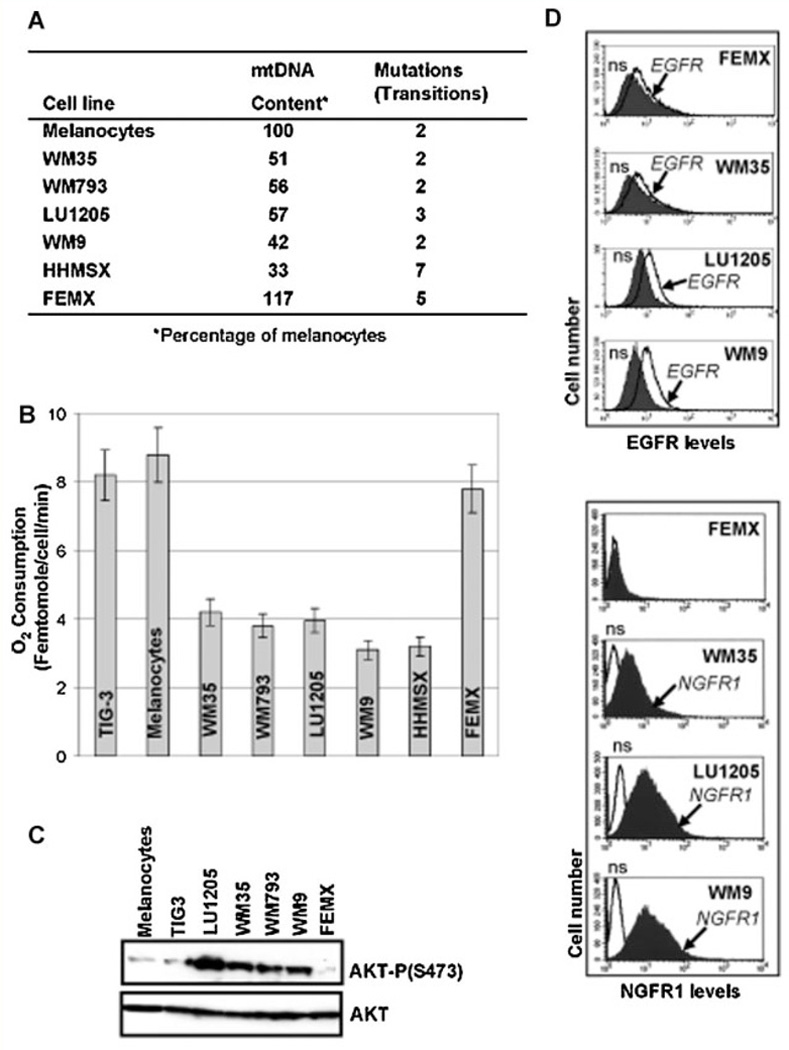
Fig. 1.
Mitochondrial (mt) DNA content, mitochondrial respiration and AKT levels in human melanoma cell lines. A: Content of mitochondrial (mt) DNA was determined using the real-time PCR as described in the Materials and Methods Section. Number of mutations in the D-loop of mtDNA is indicated. All of these mutations represent previously reported polymorphisms. B: The rate of oxygen consumption for normal human fibroblasts TIG-3, human melanocytes and melanoma lines was determined using an oxygen electrode unit. C: Western blot analysis of total and phospho-AKT levels in melanocytes, TIG-3 fibroblasts and indicated melanoma lines. D: Surface levels of EGFR and NGFR1 p75 in human melanoma cells were determined by immunostaining with anti-EGFR-PE and anti-NGFR1-PE mAbs using FACS analysis; n.s., nonspecific staining.

