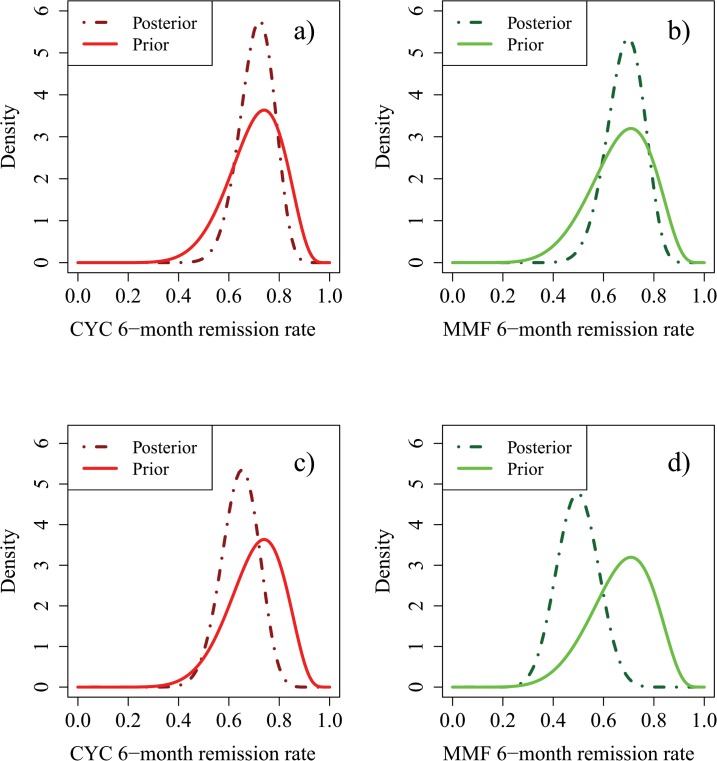
Fig 5. Posterior densities for pC and pM based on the prior of Fig 4 following observation of 20 patients treated on each study arm, with 14/20 successes on CYC and 14/20 successes on MMF (Hypothetical Scenario 1), or with 14/20 successes on CYC and 7/20 successes on MMF (Hypothetical Scenario 2). Fig 5A) and 5C) are reprinted from [7] under a CC BY license, with permission from the authors, original copyright 2014.
Fig 5A): Prior and posterior densities for pC in Hypothetical Scenario 1. Fig 5B): Prior and posterior densities for pM in Hypothetical Scenario 1. Fig 5C): Prior and posterior densities for pC in Hypothetical Scenario 2. Fig 5D): Prior and posterior densities for pM in Hypothetical Scenario 2.

