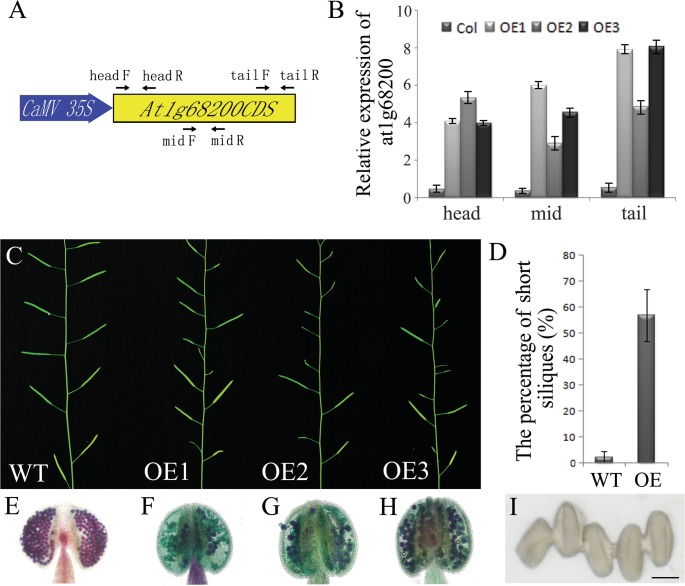
Fig 3. Characterization of AtTTP-OE line (A) Structure of the AtTTP over-expressing gene.
The primers of head, mid and tail are used for real-time PCR amplification. (B) Real-time PCR analysis of AtTTP in wild-type and OE1-3 mutant floral buds. The primer positions were shown in Fig. 3A. Each expression level was normalized to that of TUBULIN. The data and errors bars are representative of 3 replicates. (C) Comparison of reproductive development in 40-d-old wild-type and OE1-3 mutant plants. (D) The percentage of short siliques in the wild-type and OE1-3 mutant plants. (E) Alexander staining of the wild-type anther. (F) Alexander staining of the OE1 mutant anther. (G) Alexander staining of the OE2 mutant anther. (H) Alexander staining of the OE3 mutant anther. (I) Adhered pollen from the OE3 lines under light microscopy. Bars = 10 μm.

