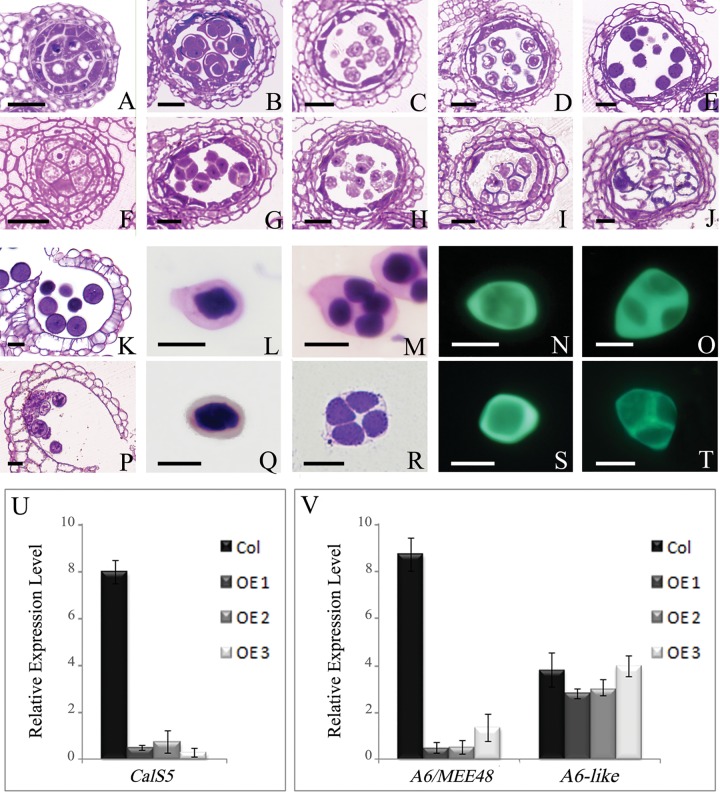
Fig 4. The anther development, callose wall, and expression analyses of CalS5, A6 and A6-like in the wild-type and AtTTP-OE line.
(A and F) Anthers at stage 6. The AtTTP-OE microsporocytes (F) are apparently closely compacted compared with those of the wild-type (A). (B and G) Anthers at stage 7. Wild-type tetrads are surrounded with callose (B), whereas the tetrads lack callose in the AtTTP-OE line (G). (C and H) Anthers at stage 8. Wild-type microspores are released from the tetrads (C), whereas microspores were still adherent in the AtTTP-OE line (H). (D and I) Anthers at stage 9. The microspores have begun to degenerate and still have not been released from the tetrads in the AtTTP-OE line (F). (E and J) Anthers at stage 10. The microspores are disintegrated in the AtTTP-OE line (J). (K and P) Anthers at stage 12. Remnants of microspores and less abnormal microspores were observed in the AtTTP-OE anther locule (P). (L, Q, N, S) The callose wall in the AtTTP-OE line was not obviously different compared with that of the wild-type. (M, R, O, T) The callose wall in the AtTTP-OE line was thinner around the tetrads compared with that of the wild-type. (U) Real-time PCR analysis of CalS5. Each expression level was normalized to that of TUBULIN. The data and errors bars are representative of 3 replicates. (V) Real-time PCR analysis of A6 and A6-like. Each expression level was normalized to that of TUBULIN. The data and errors bars are representative of 3 replicates. Bars = 10 μm.

