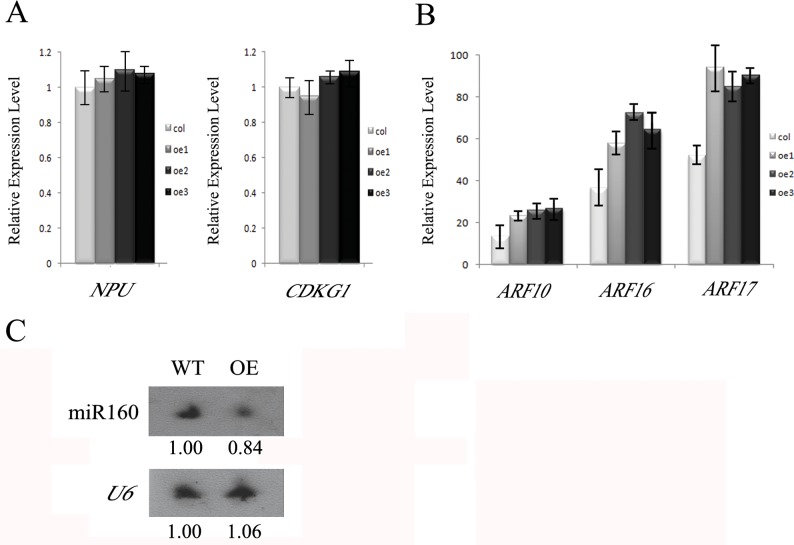
Fig 5. Expression analysis of NPU, CDKG1, ARFs and miRNAs in the AtTTP-OE line.
(A) Real-time PCR analysis of NPU and CDKG1 in the AtTTP-OE line. Each expression level was normalized to that of TUBULIN. The data and errors bars are representative of 3 replicates. (B) Real-time PCR analysis of ARF10, ARF16 and ARF17 in the AtTTP-OE line. Each expression level was normalized to that of TUBULIN. The data and errors bars are representative of 3 replicates. (C) Northern blotting hybridization of mature miR160 in the AtTTP-OE line.

