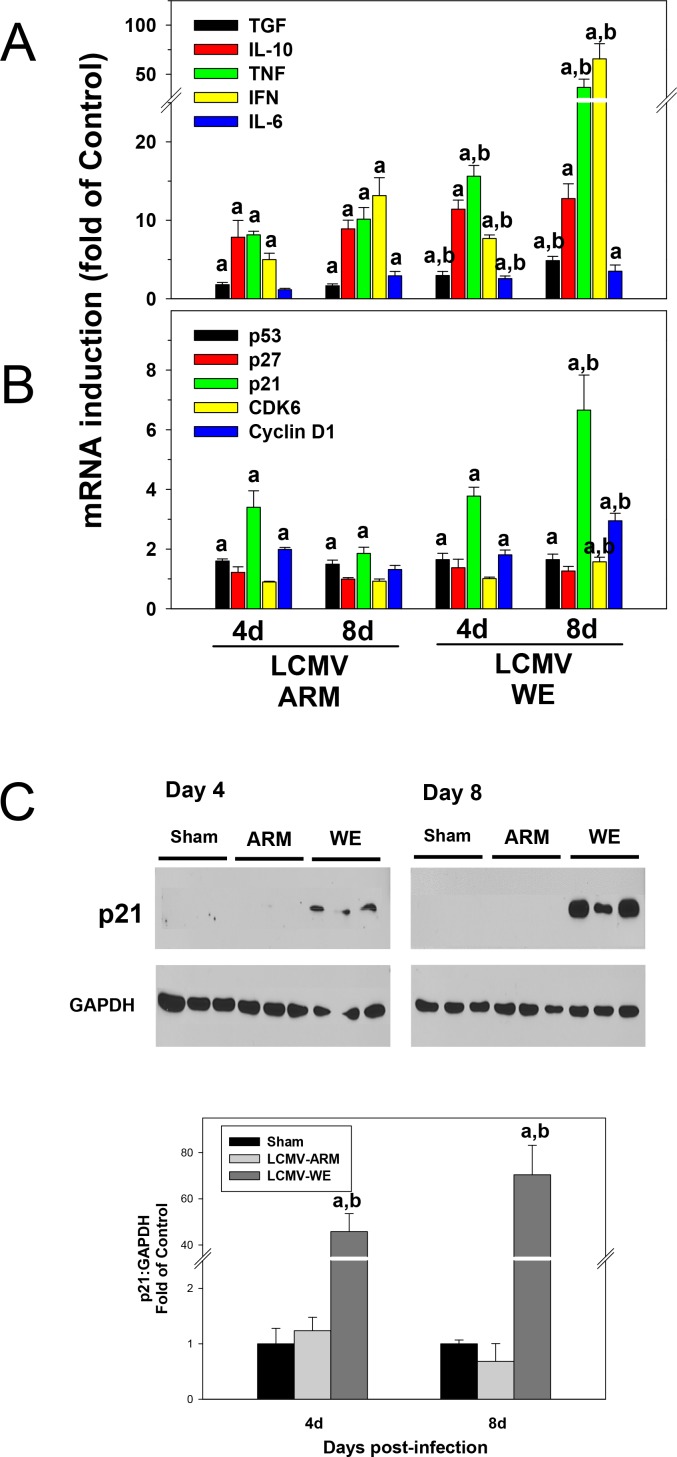
Fig 4. Proinflammatory cytokines and cell cycle gene responses in liver of LCMV-infected mice.
Hepatic mRNA was extracted from LCMV-infected mice and real-time RT-PCR for inflammatory (Panel A) and cell cycle (Panel B) genes was performed as described in Materials and Methods. Western blot analysis of p21 protein expression (Panel C) was determined as described in Materials and Methods. GAPDH was used as a loading control. Representative bands (upper) and quantitative densitometry (lower) are shown. Quantitative data are means ± SEM (n = 4–7).a, P<0.05 compared with sham infection;b, P<0.05 compared with LCMV-ARM infection. Data are representative of two experiments performed with liver extracts collected from three mice in each group.

