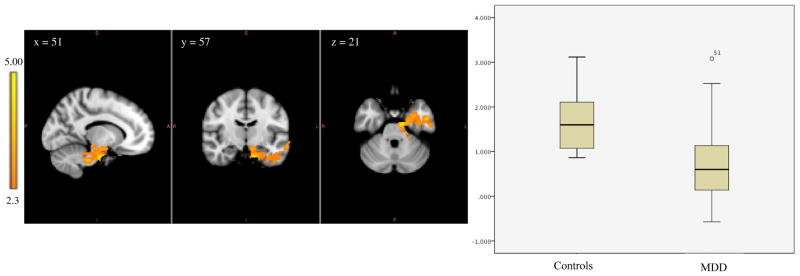
Figure 1. Lower Amygdala Connectivity in Adolescents with MDD than Controls.

Left image depicts functional connectivity of amygdala-hippocampus and amygdala-brainstem in which the control group has higher functional connectivity compared to the MDD group. The coordinates represent the position of the voxel with the highest intensity in MNI standard space (z-stat = 5.00); Right image compares the range of functional connectivity z-scores between the amygdala and these regions for the two groups.
*Note: Analyses were repeated with MDD outlier removed and remained significant; t(67) = 5.77, p < .001
