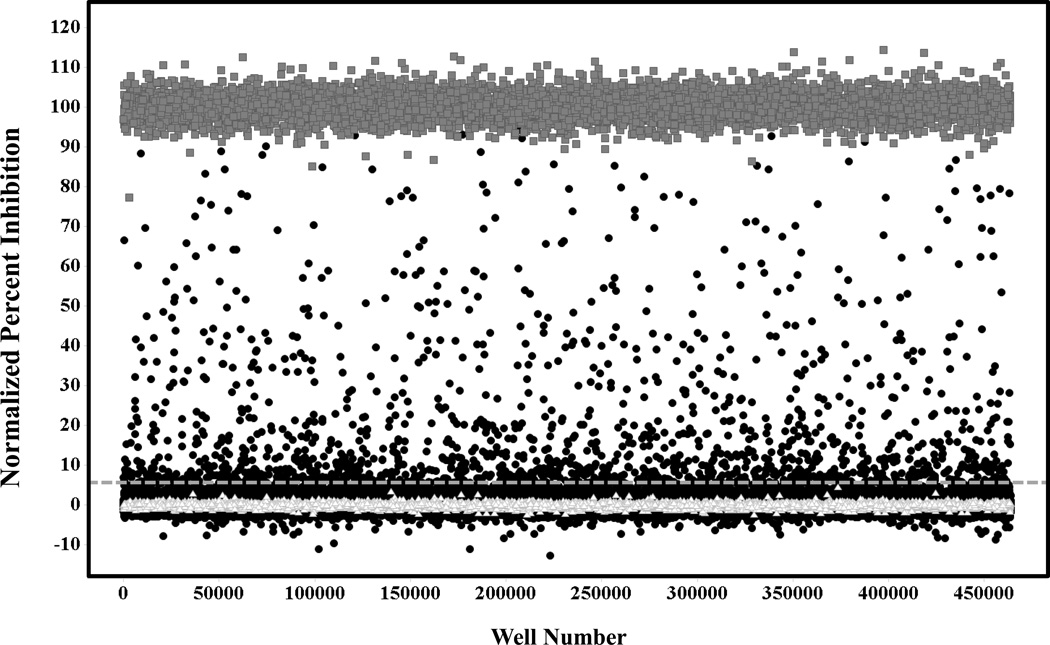
Figure 3. Primary screen scatter plot.
(∆) Represent low control wells containing DMSO only, (●) represent data wells containing compounds and (■) represent high control wells containing compound CID18353708. The dashed line represents the hit cut-off. Compounds with inhibition above this line were considered primary actives or hits.

