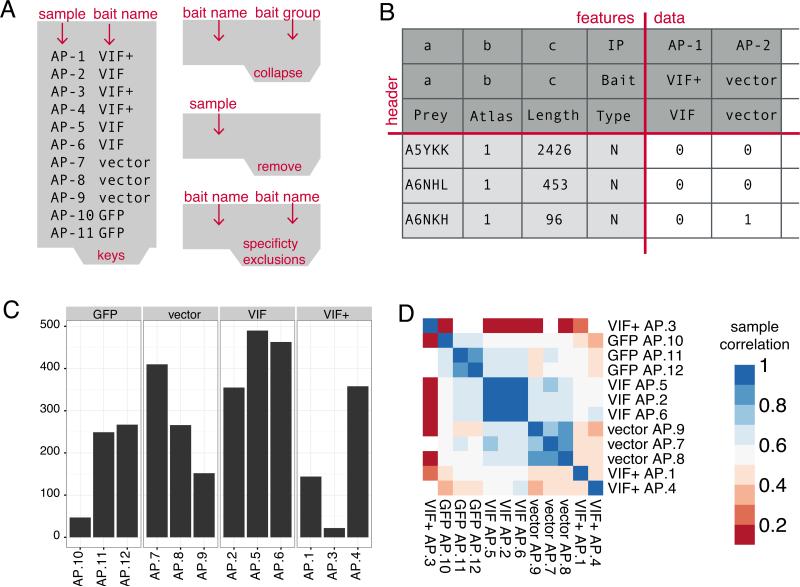
Figure 2.
A) Tab-separated input files required to run a first pass of MiST B) Output bait-prey matrix after the pre-processing protocol (1) that serves as input for the MiST protocol (3) C) Output of the quality control protocol depicting the number of detected proteins across replicates for a single bait. Samples AP-10 and AP-3 are candidates for removal from the data set D) Output of the quality control protocol depicting a hierarchically clustered heatmap of the pairwise sample correlation matrix. The signal from sample AP-3 is clearly uncorrelated with the VIF+ replicates while hIP34-15 correlation with the GFP group is acceptable.

