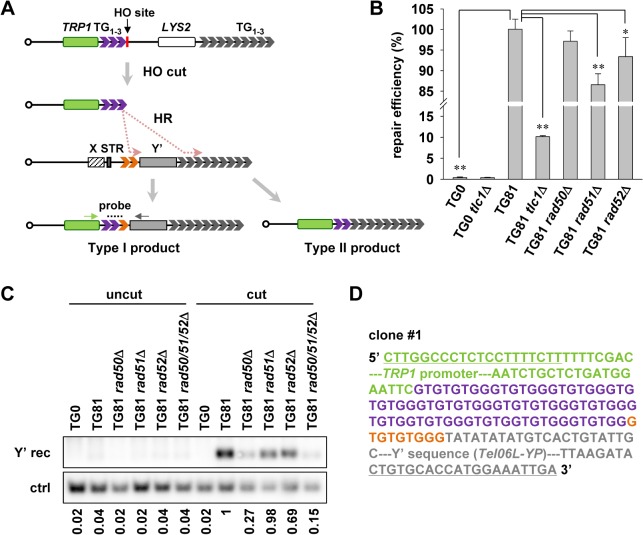
Fig 2. Subtelomeric Y’ element recombination occurs in the presence of telomerase.
(A) Schematic representation of the strategy to detect Y’ recombination in the presence of telomerase (not to scale). 81 bp of TG1–3 seed (in purple) is inserted at the ADH4 gene locus on chromosome VII, flanked by a TRP1 marker gene (in green) and an HO endonuclease cutting site. The LYS2 gene was placed between the natural telomere of VII-L and the ADH4 locus to serve as a genetic marker to monitor HO cutting. After HO induction by galactose, a short telomere with 81 bp of TG1–3 sequence is generated de novo through HR activity in two distinct regions of the donor telomere: one in TG1–3 tracts (in orange) between the STR and the Y’ element (Type I) and the other in the terminal TG1–3 tracts (Type II). The telomerase-mediated elongation is omitted in this diagram. The resulting Type I recombination products can be detected by PCR amplification using primers specific for TRP1 (indicated by a green arrow) and Y’ consensus sequences (indicated by gray arrow) followed by Southern blot with probes hybridized to TG1–3 repeats (indicated by dashes). (B) Cell viability assay for chromosome healing. Proportional yeast cells were plated onto galactose (cut) or glucose-containing medium (uncut). The numbers of colonies formed on the plates were counted and repair efficiency was calculated by dividing the number of colonies on “cut” plates by that on “uncut” plates. The error bars indicates the standard deviations. *p < 0.05 and **p < 0.01. (C) Southern blot detection of Y’ recombination. After HO induction by galactose in liquid culture for 24 h, the isogenic strains (labeled on the top) were subjected to genomic DNA extraction (cut). The uninduced strains were also included in the assay as “uncut” controls. PCR was then performed using primers indicated in A. The PCR products were then subjected to Southern blot with probes recognizing TG1–3 sequence (Y’ rec). As the loading control, the proportional genomic DNA was digested with EcoRI endonuclease to generate a DNA fragment of 1 kb containing the POL1 gene sequence and subjected to Southern blot using a probe specific for POL1 sequence (ctrl). The DNA signals were quantified by software (Multi Gauge). The number below each lane indicates the Y’ recombination efficiency, which is defined by dividing the intensity of signal of Y’ recombination with that of the internal control. The efficiency of all the samples were compared to that of TG81 cut sample which was set as “1”. (D) A representative sequence of one of the three clones showing the sequence of Y’ recombination products. Part of the TRP1 promoter (in green), 78 bp of TG1–3 seed sequence (in purple), 9 bp of recombined TG1–3 sequence (in orange) and part of the Y’ sequence from telomere VIL (Tel06L-YP, in gray) are shown. The underlined sequences are primers for PCR as indicated in (A). The full sequence for the PCR product is shown in S1 Fig.

